This blog is a small tutorial on how you can export data that contains coordinates from a Kafka topic as JSON (irrespective of the original serialisation of the data in the topic - AVRO, Protobuf, etc.) and visualize it with D3.js.
To simplify the tutorial, we export the data as JSON before visualising it. But if you see my Kafka Data Access blog you can programatically stream data live off a Kafka topic using SQL and via a secure data access layer.
For those that don't know Lenses, it provides an enterprise-grade data access, monitoring, administration and governance portal for Apache Kafka which saves teams having to build custom tooling and accelerates Kafka adoption.
Pre-requisites
To make it easier to follow this guide just download the free all-in-one Lenses Docker image that also includes a working Kafka environment.
Why Visualize
There are many reasons for visualizing data including the following :
- You get a higher level overview of your data.
- You might be able to identify patterns on your data.
- You might understand your data better, especially when you dealing with lots of data.
- Beautiful visualizations can be put into company reports.
About Spatial Data
Spatial data contains information about the longitude and latitude, which is what it is going to be put on a map.
When visualizing spatial data, you also get the following benefits:
- You can see the current position of your objects.
- You can verify the route of your objects.
- You can detect delays or other kinds of problems.
What is D3.js
D3.js (Data Driven Documents) is a powerful JavaScript library for visualization.Despite its simple name, D3.js is a professional tool that offers functions that whenapplied to DOM elements can transform the resulting HTML, SVG or CSS documents.
You can learn more about D3.js here.
The first thing you should do is run the Lenses Box Docker image:
```
docker run --name=lenses-dev -e ADV_HOST=127.0.0.1 -e
EULA="https://dl.lenses.stream/d/?id=xyz"\
--rm -p 3030:3030 -p 9092:9092 -p 2181:2181 -p 8081:8081 -p 9581:9581 -p
9582:9582\
-p 9584:9584 -p 9585:9585 lensesio/box
```
(NOTE: If you register for Box you will get an email with a unique free license key the above example has “xyz” as the license key which will not work)
Then, you will have to login to Lenses Box from a browser on port 3030 using admin
The Kafka topic that will be used is sea_vessel_position_reports
```
{
    "key": {
        "MMSI": 265650970
    },
    "value": {
        "Type": 1,
        "Repeat": 0,
        "MMSI": 265650970,
        "Speed": 0,
        "Accuracy": true,
        "Longitude": 11.841745,
        "Latitude": 57.66149333333333,
        "location": "57.661493,11.841745",
        "Course": 326.8,
        "Heading": 511,
        "Second": 32,
        "RAIM": false,
        "Radio": 197924,
        "Status": 0,
        "Turn": -128,
        "Maneuver": 0,
        "Timestamp": 1491318143985992700
    },
    "metadata": {
        "offset": 0,
        "partition": 0,
        "timestamp": 1573321860392,
        "__keysize": 10,
        "__valsize": 79
    }
}
```
You will often be required to preprocess your data.
In this tutorial, we are just going to extract the fields that interest us
and put them into a new Kafka topic. To keep things simple, we are only going to
extract the data for a single sea vessel using SQL Studio. The code that will
be executed in SQL Studio is the following:
```
CREATE TABLE spatial_data(_key string, Latitude string, Longitude string)
FORMAT(JSON, JSON);
INSERT INTO spatial_data
SELECT Latitude,Longitude FROM sea_vessel_position_reports WHERE
MMSI='266164000';
```
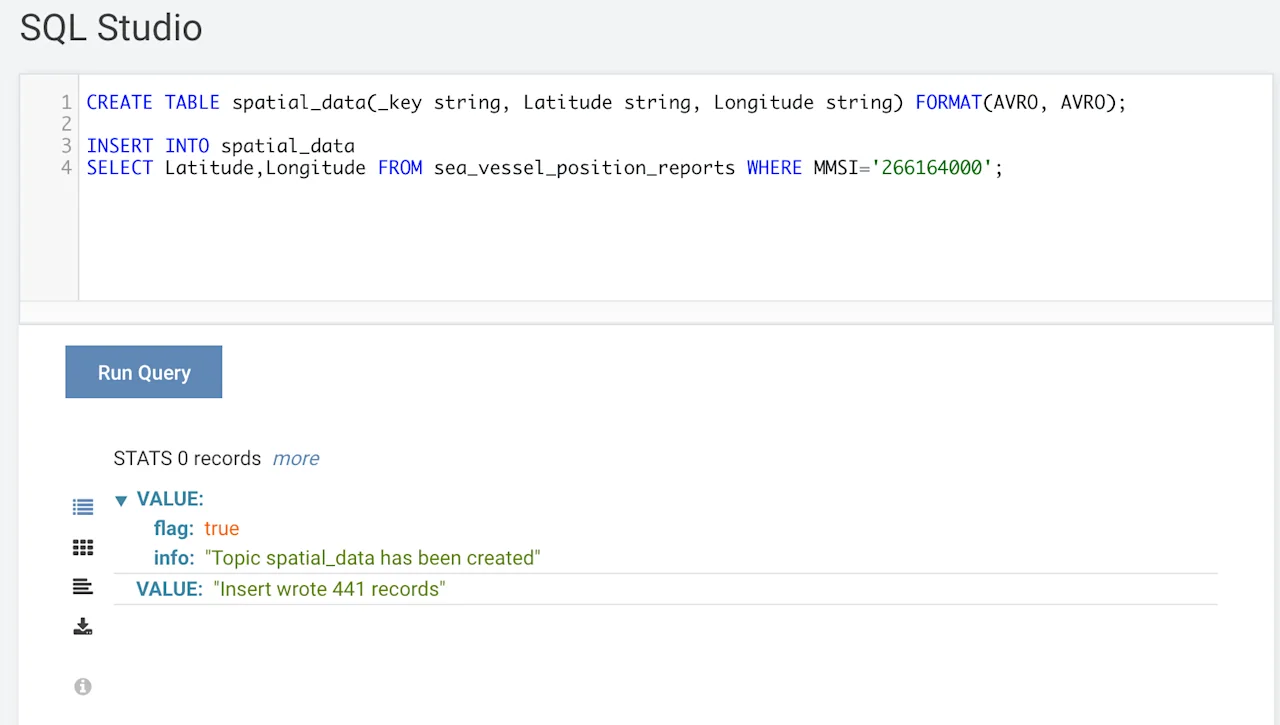
The data in spatial_data
```
{
    "value": {
        "Latitude": "58.76088333333333",
        "Longitude": "9.898933333333334"
    },
    "metadata": {
        "offset": 0,
        "partition": 0,
        "timestamp": 1573323587623,
        "__keysize": 0,
        "__valsize": 41
    }
}
```
Exporting Data
You will need to export it in JSON format. As we are using plain text format, we can export the
contents of the spatial_data
in the image below:
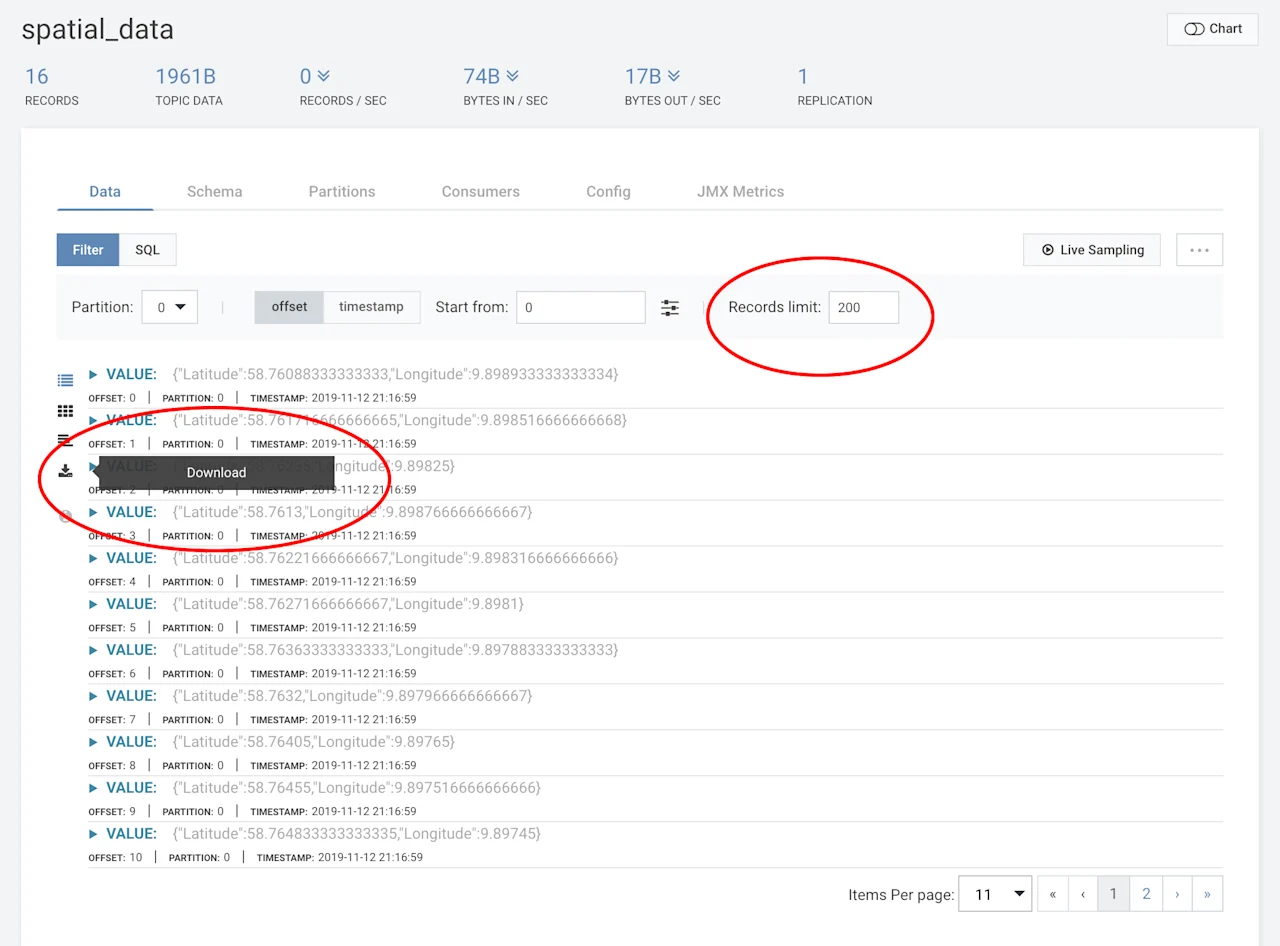
As I hinted at the beginning of this blog, you can also access data via CLI and API clients.
Once you press the Download
file on your local filesystem – in this case as /tmp/exported_data.json
Note that if you have lots of data in your Kafka topic, you might need to adjust the
value of the Records Limit
The format of the JSON records contained in /tmp/exported_data.json
```
{
    "value": {
        "Latitude": 58.76088333333333,
        "Longitude": 9.898933333333334
    },
    "metadata": {
        "offset": 0,
        "partition": 0,
        "timestamp": 1573586219346,
        "__keysize": 0,
        "__valsize": 60
    }
}
```
As the exported records contain more data than needed, we are going to process it with
the jq(1)
cat /tmp/exported_data.json | jq '.[] | {value}' > /tmp/1.json
The new format will be as follows:
```
{
  "value": {
    "Latitude": 58.76088333333333,
    "Longitude": 9.898933333333334
  }
}
```
Then you will need to process the output file a little more in order to add a ,
character after each JSON record and embed the entire file into []
talking about an array. So, you will need to execute the next commands:
```
sed '1s/^/\[/' /tmp/1.json > /tmp/2.json
sed '$s/}/}\]/' /tmp/2.json > /tmp/3.json
sed 's/\(^}$\)/},/g' /tmp/3.json > /tmp/data.json
```
The last thing that you will need to do with the JSON file is to put it on the Internet
in order to read it from JavaScript. The reason for this is that JavaScript does not allow
you to read files located at the filesystem of the local machine due to security reasons.
In this case, the JSON file will be put in a GitHub repository and will be stored
in github.com/mactsouk/datasets/blob/master/data.json and will be accessed
as raw.githubusercontent.com/mactsouk/datasets/master/data.json
You can put your JSON files in any place you want as long as they are accessible from
the JavaScript code.
Visualizing Data
Now that you have your data in JSON format, you will use D3.js in order to visualize it.
As JavaScript code is embedded in HTML files, the final version of the D3.js code can
be found in visualize-spatial.html
```
<!DOCTYPE html>
<meta charset="utf-8">

<style>
path {
  stroke: white;
  stroke-width: 0.25px;
  fill: grey;
}
</style>

<body>
<script src="https://d3js.org/d3.v3.min.js"></script>
<script src="https://d3js.org/topojson.v0.min.js"></script>

<script>
var width = 1600,
    height = 1000;

var projection = d3.geo.mercator()
    .center([0, 5 ])
    .scale(200)
    .rotate([-180,0]);

var svg = d3.select("body").append("svg")
    .attr("width", width)
    .attr("height", height);

var path = d3.geo.path()
    .projection(projection);

var g = svg.append("g");

d3.json("https://gist.githubusercontent.com/d3noob/5189284/raw/7c4bbf3f44d2aeb4d01ca6365b7978b09fdc8766/world-110m2.json",
    function(error, topology) {

    d3.json("https://raw.githubusercontent.com/mactsouk/datasets/master/data.json", function(error, data) {
        if (error) { console.log(error); }
        console.log("Reading Data!");
        console.log(data);

     g.selectAll("circle")
        .data(data)
        .enter()
        .append("circle")
        .attr("cx", function(d) {
                return projection([d.value.Longitude, d.value.Latitude])[0];
        })
        .attr("cy", function(d) {
                return projection([d.value.Longitude, d.value.Latitude])[1];
        })
        .attr("r", "3px")
        .attr("fill", function() {
            return "hsl(" + Math.random() * 360 + ",100%,50%)";
       });
 });

g.selectAll("path")
      .data(topojson.object(topology, topology.objects.countries)
          .geometries)
    .enter()
      .append("path")
      .attr("d", path)
});

var zoom = d3.behavior.zoom()
    .on("zoom",function() {
        g.attr("transform","translate("+
            d3.event.translate.join(",")+")scale("+d3.event.scale+")");
        g.selectAll("circle")
            .attr("d", path.projection(projection));
        g.selectAll("path")
            .attr("d", path.projection(projection));

  });
svg.call(zoom)

</script>
</body>
</html>
```
If you are not familiar with D3.js you might find the JavaScript code quite complex.
However, if you have your spatial data in the same format as data.json
can visualize it without any code changes. Additionally, visualize-spatial.html
contains extra code that allows you to zoom and pan your maps!
The output of visualize-spatial.html
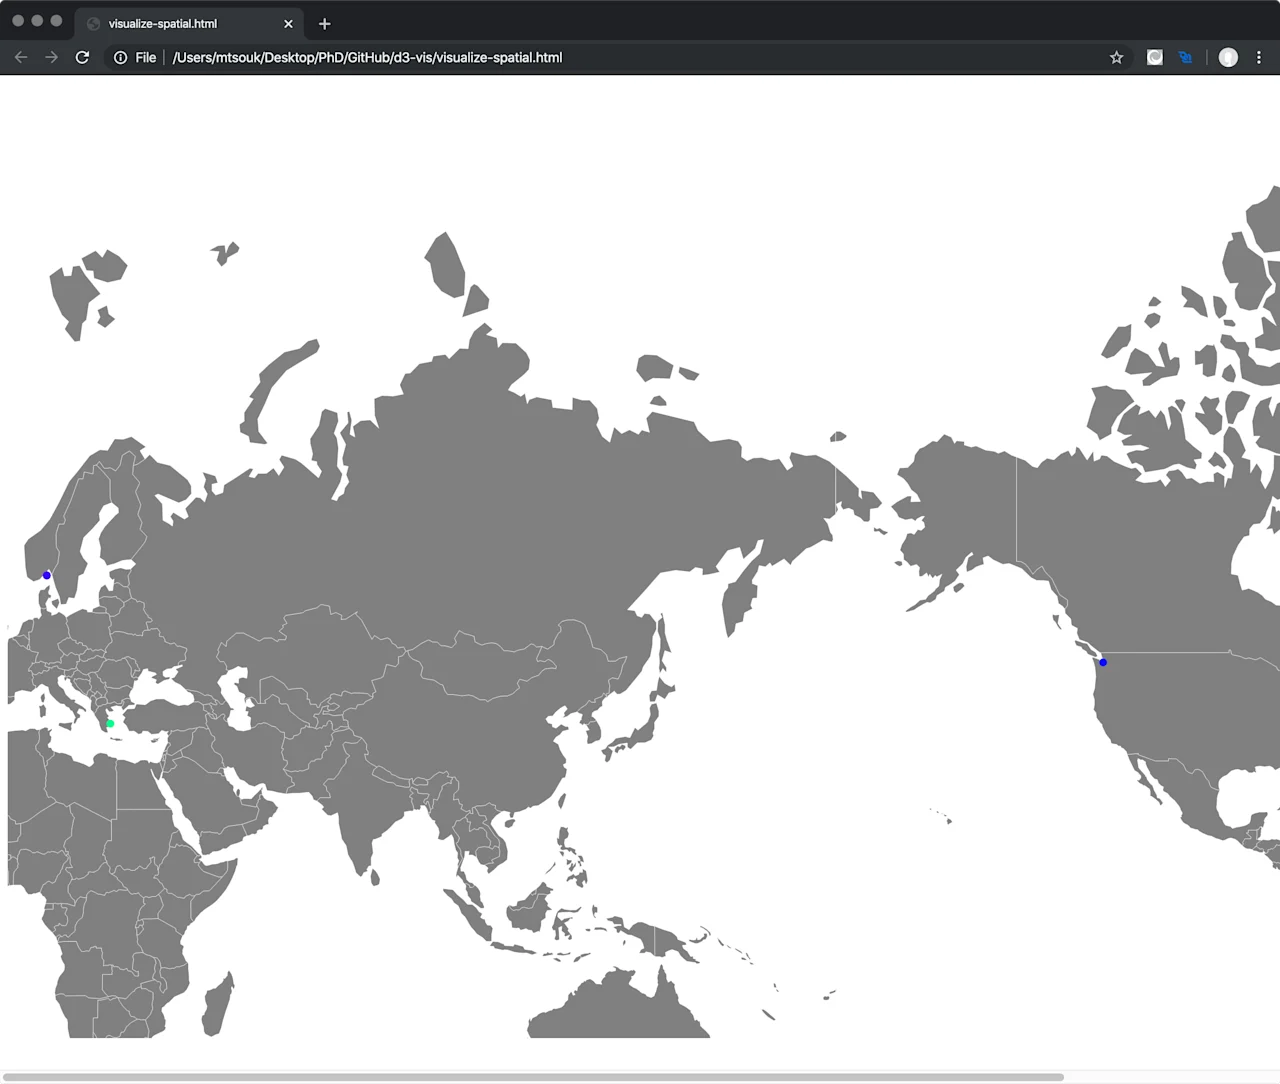
Conclusions
Once you have your data stored in Lenses, you can do whatever you want with it.
Discover the power of Lenses described by these four usecases for Apache Kafka & Kubernetes.