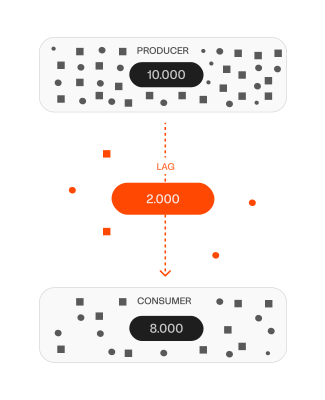
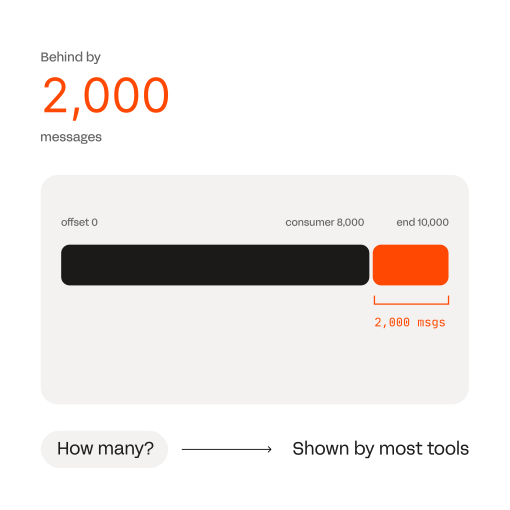
Consumer lag represents the difference between what your producer has written and what your consumer has processed. If a topic has 10,000 messages and your consumer has processed 8,000, the lag is 2,000 messages. The raw number, however, tells you very little. Context is essential.
More context A lag of 2,000 messages means different things depending on your throughput:
High-throughput topic (1,000 msg/sec): 2,000 messages = 2 seconds behind. Generally acceptable for most use cases.
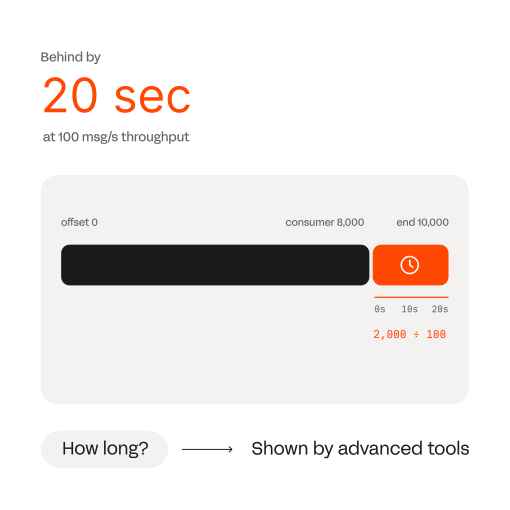
Low-throughput topic (100 msg/sec): 2,000 messages = 20 seconds behind. May violate SLAs depending on your requirements.
Very low throughput (10 msg/sec): 2,000 messages = 200 seconds behind. Significant delay for real-time workflows.
The same lag number represents vastly different operational states. This is why tracking lag as a time metric (seconds or minutes behind) is more useful than message count.
Graphic producer vs consumer
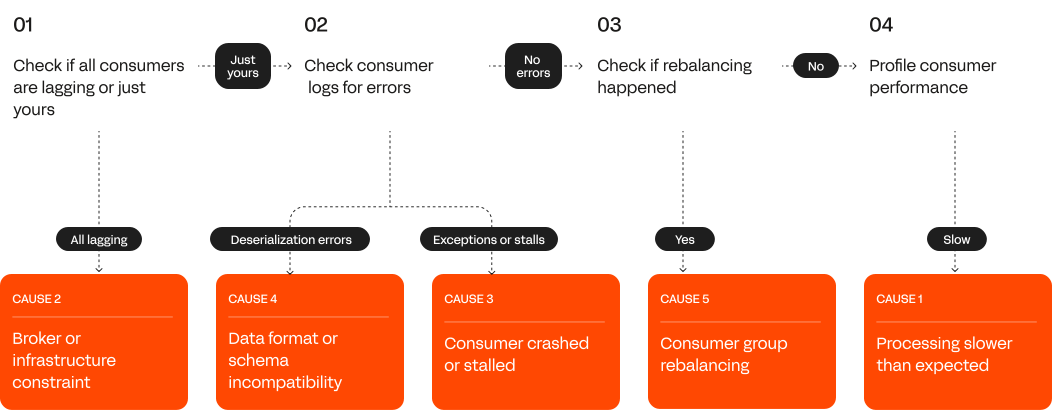
Common causes of lag
Lag isn't inherently a problem. Growing lag is. Lag typically increases when:
01
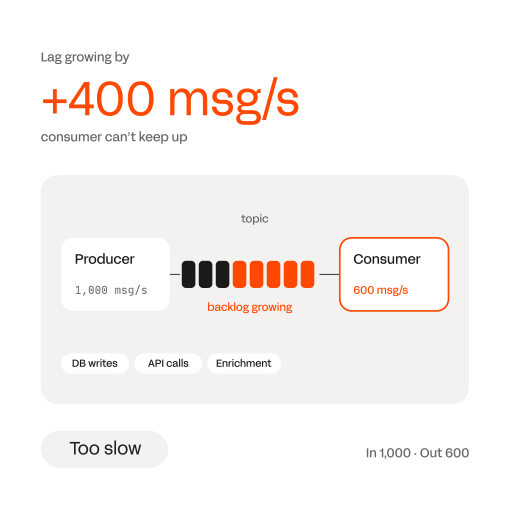
Your consumer processes slower than the producer producesThe consumer is doing work that takes time (database writes, API calls, enrichment).
01-cause-consumer-slower 2
02
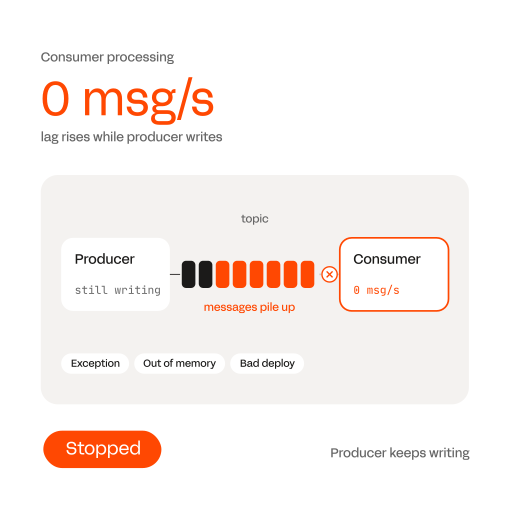
Your consumer stops processingAn exception, a resource constraint, or a deployment issue halts the consumer.
02-cause-consumer-stops 2
03
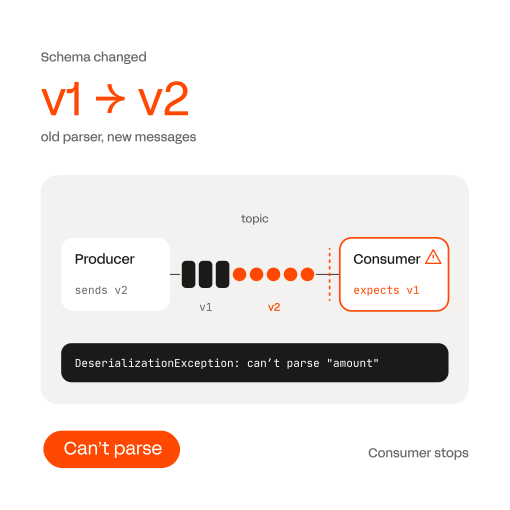
Your data format changedYour consumer can't parse messages in the new format, so it stops.
03-cause-data-format-changed 2
04
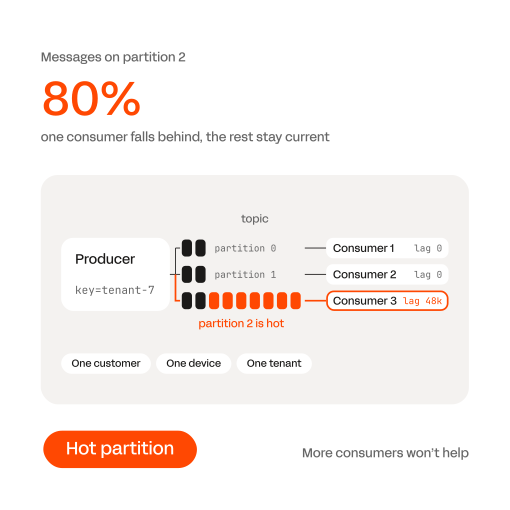
Your data is badly partitionedSkewed keys send a disproportionate share of messages to one partition, and the consumer assigned to it falls behind.
04-cause-bad-partitioning 2
Lag typically decreases when your consumer catches up: it processed the backlog and is now current with the producer.
Lag velocity > absolute lag
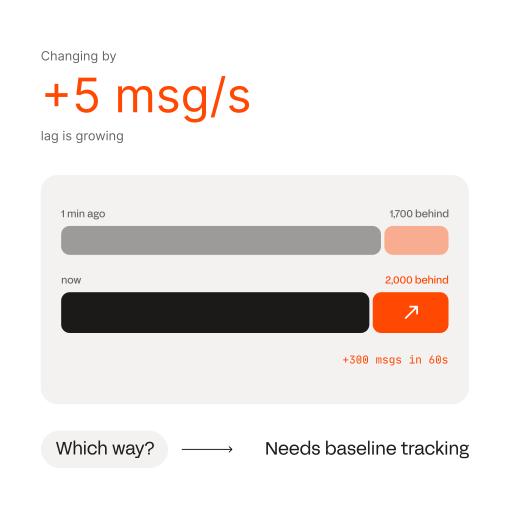
The rate of change is the key signal:
01
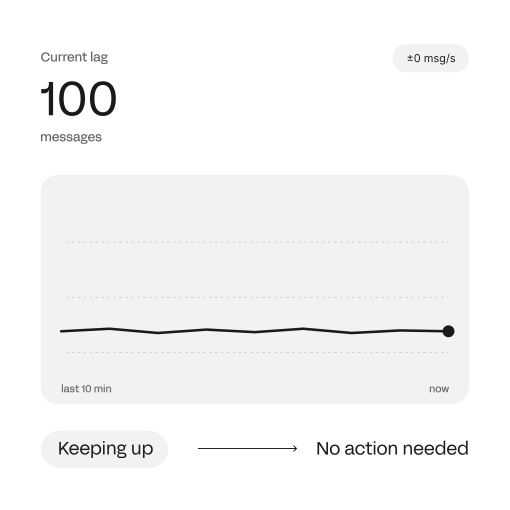
Lag stable at 100 messagesYour consumer is keeping up. No action needed.
04-velocity-stable 2
02
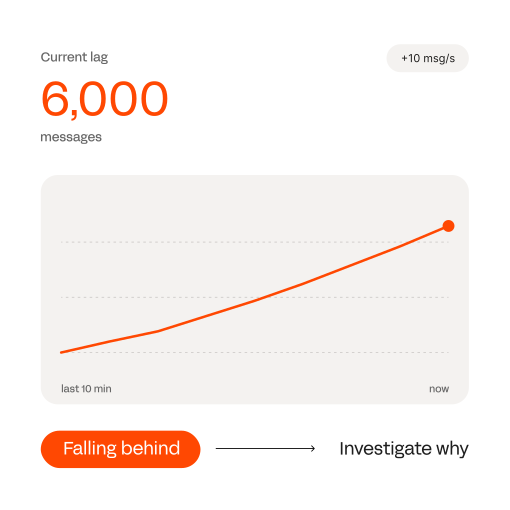
Lag growing 10 messages/secYour consumer is falling behind. Investigate why.
05-velocity-growing 2
03
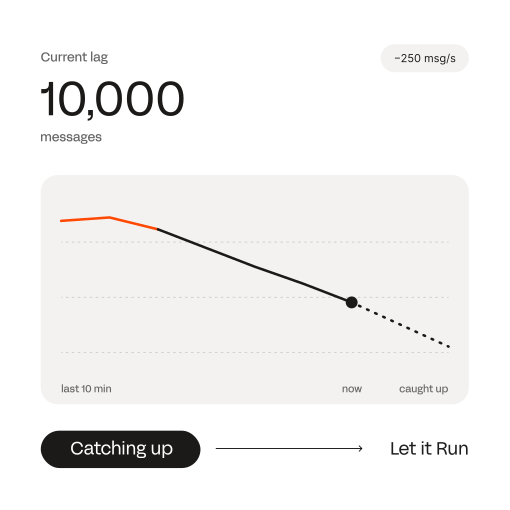
Lag at 10,000 messages but decreasingYour consumer is working through a backlog. Let it run.
06-velocity-decreasing 2
A consumer that's 10 seconds behind is fine if it stays 10 seconds behind. A consumer whose lag increases by 1 second every second is an issue, regardless of the absolute lag value.
Lag in streaming architectures
In systems that depend on real-time data (fraud detection, payment processing, inventory management), lag directly affects the quality of decisions.
If your trading commodities system is processing trades that are 30 seconds old, it's detecting trades 30 seconds late. In high-frequency contexts, that lag compounds: missed fraud, delayed alerts, or late inventory updates.
This is why monitoring lag isn't optional for streaming systems; it's part of your operational health.
Consumer lag metrics to track
When monitoring consumer lag, track these three metrics:
01
Current lag (message count)How many messages behind right now?
07-metric-message-count 2
02
Lag as time (seconds or minutes)How far behind in wall-clock time, given current throughput?
08-metric-lag-as-time 2
03
Lag velocity (change per second)Is lag growing, stable, or shrinking?
09-metric-lag-velocity 2
Most Consumer Lag monitoring tools show only the first. Advanced tools show the first two. The third one requires baseline tracking and trend analysis.
Establishing a baseline
Before setting alerts, understand what's normal for each consumer:
A consumer that normally runs with lag of 5–10 messages is different from one that runs with lag of 100–500 messages.
A consumer that occasionally spikes to 50,000 messages but recovers over hours is different from one that grows monotonically.
Different topics and consumer types have different acceptable ranges.
Spend a week or two observing your consumers under normal conditions. That's your baseline. Alerts should trigger when lag deviates significantly from that baseline, not on absolute thresholds.
Kafka Skill: kafka-consumer-lag
This skill handles baseline tracking and anomaly detection. It can flag when a consumer's lag behavior changes from its historical pattern, which is often more useful than static threshold-based alerts.
No historical data; you need to run it multiple times to see trends
Shows only message count lag, not time-based lag
Partition-level detail requires manual inspection
Requires broker access and familiarity with CLI tools
No insight into why lag is high (requires cross-referencing with other data sources)
Time to answer key questions
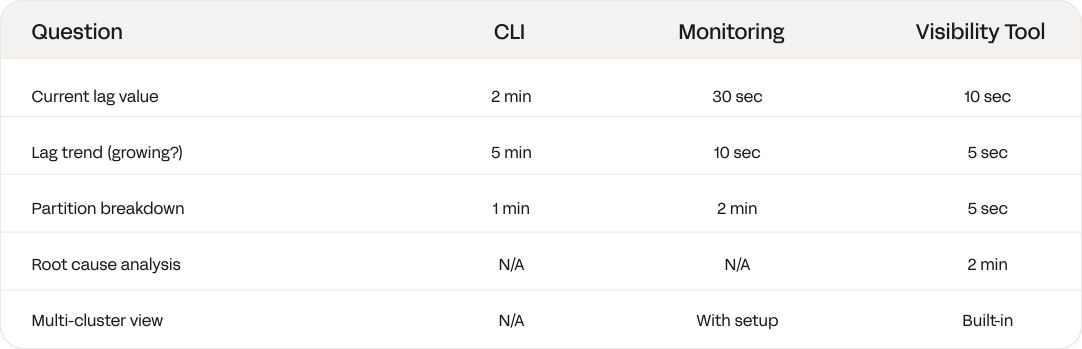
"What's my current lag?" ~2 minutes
"Is lag growing?" ~5 minutes (run it twice, compare)
"Which partition is stuck?" ~1 minute
"Why is lag high?" Unknown without additional investigation
2:Monitoring system
Setup: Collect JMX metrics from consumer groups into your monitoring platform (Prometheus, Datadog, New Relic, etc.).
Strengths
Historical data and trends
Visual dashboards
Can set threshold-based alerts
Aggregates data from multiple clusters
Limitations
Only shows metrics, not actual data
If lag is high because of a schema mismatch, the dashboard won't tell you that
Requires metric collection and retention infrastructure
Alert tuning takes time (need baselines first)
Time to answer key questions
"What's my current lag?" ~30 seconds
"Is lag growing?" ~10 seconds
"Which partition is stuck?" ~2 minutes (if metrics are at partition level)
"Why is lag high?" Unknown without additional investigation
3:Kafka operating layer
Setup: Unified view across topics, consumer groups, schemas, and data (Lenses, Conduktor, etc.).
Strengths
One place to see metrics, data, and metadata
Can compare messages at different offsets
Can cross-reference with schema changes
Multi-cluster view in a single pane
Can directly inspect data that's causing issues
Limitations
Requires tooling deployment and maintenance
Not necessary for small, simple deployments
Time to answer key questions
"What's my current lag?" ~10 seconds
"Is lag growing?" ~5 seconds
"Which partition is stuck?" ~5 seconds
"Why is lag high?" ~2 minutes (can inspect data, schema, and metrics together)
Comparison
consumer-lag-comparison-table
Choosing an approach
Use CLI if:
You have a small number of consumers
You're investigating a one-time issue
You don't have monitoring infrastructure in place
Use Monitoring if:
You have many consumers spread across multiple topics
You need historical trends and alerting
You already have a monitoring system in place
Use a Kafka tool if:
You need to investigate root causes (not just metrics)
You manage multi-cluster deployments
You want to correlate lag with real data and schema changes
Key Kafka consumer metrics to track
Regardless of approach, track these three metrics:
Current lag (message count)
How many messages behind right now?
Lag as time
Divide lag by throughput. A lag of 1,000 messages at 100 msg/sec is 10 seconds. At 10 msg/sec, it's 100 seconds. The message count alone is misleading.
Lag velocity
Is lag stable, growing, or shrinking? Velocity change is often a better signal than absolute lag.
Setting baselines and alerts
Before setting alerts, understand what's normal for each consumer:
Track lag for a week under normal conditions
Identify your typical lag range and occasional spikes
Set alert thresholds at 2–3x your normal peak
Threshold-based alerting on absolute lag values often produces false positives (alerting on normal spike) or false negatives (missing real issues).
Kafka Skill: kafka-consumer-lag
Tracks baselines and detects when a consumer deviates from its normal pattern, which is more reliable than static thresholds.