As a secure portal for Apache Kafka, Lenses opens up access to streaming data to new usecases and users including data scientists, analysts and those not skilled on streaming technologies.
Data can be protected with role-based security, anonymised and queried with SQL and via a secure UI, CLI or API.
The Lenses lenses-python
This blog outlines using the library to develop your own Lenses clients in Python 3. We will create two Python 3 utilities to create a box plot of the data found in a Kafka topic.
The first utility stores the output in a PNG file whereas the second utility uses a Jupyter Notebook to present the output.
Pre-requisites
Download the free Lenses “Box”, a single container including an instance of Kafka, Lenses and sample streaming data which we’ll need for this walkthrough.
You are also going to need Lenses and a working Python 3 installation. If you want to use Jupyter, you will also need a working Jupyter installation.
Installing Lenses Python Library
You can manually install lenses-python
```
git clone https://github.com/landoop/lenses-python
cd lenses-python
pip3 install .
```
Depending on your UNIX machine, you might need root privileges when executing thepip3 install .
After a successful installation, you can try the following to make sure that everything
works as expected:
```
python3
Python 3.7.4 (default, Jul  9 2019, 18:13:23)
[Clang 10.0.1 (clang-1001.0.46.4)] on darwin
Type "help", "copyright", "credits" or "license" for more information.
>>> from lenses_python.lenses import lenses
>>>
```
Connecting to Lenses using lenses-python
The presented Python 3 script will illustrate how you can connect to a running
Lenses instance, which in this cases in a Lenses Box, using lenses-python
The Python 3 code, which is saved in conn_details.py
```
from lenses_python.lenses import lenses

data=lenses("http://127.0.0.1:3030","admin","admin")
print (data.GetCredentials())
```
The parameters of the lenses()
lenses_python.lenses
define the parameters of the connection, which are the URL of Lenses, the username
and the password, respectively. What is returned is the parameters of the connection.
Executing conn_details.py
```
python3 conn_details.py
{'user': 'admin', 'schemaRegistryDelete': True, 'permissions':
['datapolicyread', 'nodata',
'tablestoragewrite', 'admin', 'alertswrite', 'tablestorageread', 'read',
'write',
'datapolicywrite', 'alertsread'], 'token': '00b5476b-fd34-4a70-b9df-
f0f62d84f3cc'}
```
If a Lenses instance is not available at the specified URL, you will get aConnection refused
Writing a Python 3 script
The presented Python 3 code will generate a box plot based on the data that is
found in a Kafka topic called “fast_vessel_processor” (You can query the data in your instance via the UI with URL: localhost:3030/lenses/#/topics/fast_vessel_processor?f=sql)

The Python 3 code, which is saved as plot_data.py
```
from lenses_python.lenses import lenses
import pandas as pd
import numpy as np
import matplotlib as mpl
import matplotlib.pyplot as plt

# Create plot in PNG file
mpl.use('agg')

data=lenses("http://127.0.0.1:3030","admin","admin")

print("Listing all topics")
print(data.TopicsNames())

r = data.SqlHandler(
  'SELECT * FROM `fast_vessel_processor`',
  ['speed'])

# print(r)

print("Type:", type(r))

for i in r:
    print(i)

dataToPlot = []

for index, row in r.iterrows():
    dataToPlot.append(row['Speed'])

# Create a figure instance
fig = plt.figure(1, figsize=(9, 6), dpi=600)

# Create an axes instance
ax = fig.add_subplot(111)

# Create the boxplot
bp = ax.boxplot(dataToPlot)

# Save the figure
fig.savefig('boxplot.png', bbox_inches='tight')
```
Executing plot_data.py
```
python3 plot_data.py
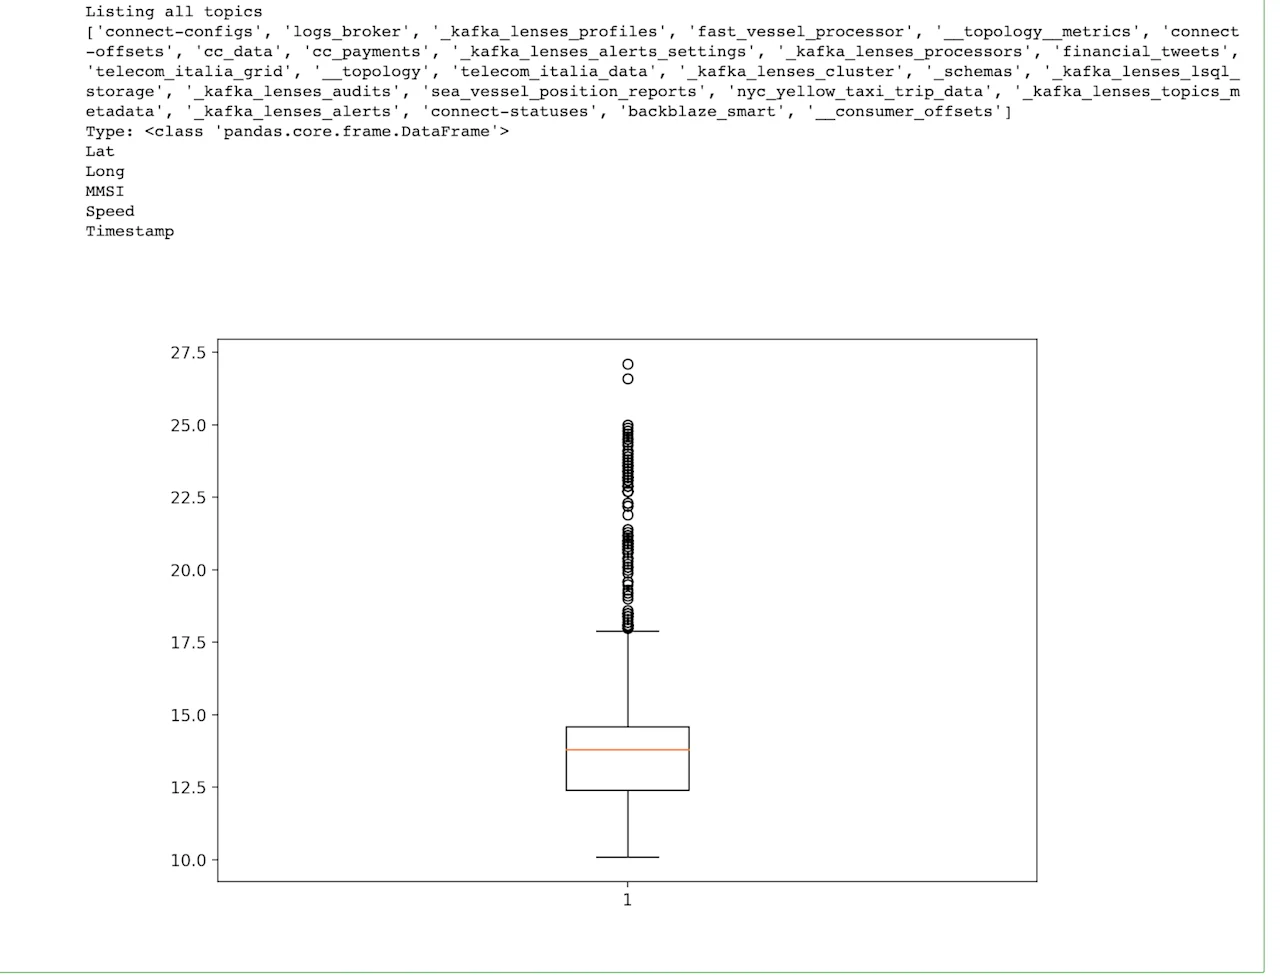
Listing all topics
['connect-configs', 'logs_broker', '_kafka_lenses_profiles', 'fast_vessel_processor',
'__topology__metrics', 'connect-offsets', 'cc_data', 'cc_payments', '_kafka_lenses_alerts_settings',
'_kafka_lenses_processors', 'financial_tweets', 'telecom_italia_grid', '__topology',
'_kafka_lenses_cluster', 'telecom_italia_data', '_schemas', '_kafka_lenses_lsql_storage',
'_kafka_lenses_audits', 'sea_vessel_position_reports', '_kafka_lenses_topics_metadata',
'nyc_yellow_taxi_trip_data', '_kafka_lenses_alerts', 'connect-statuses', 'backblaze_smart', '__consumer_offsets']
Type: <class 'pandas.core.frame.DataFrame'>
Lat
Long
MMSI
Speed
Timestamp
```
So, plot_data.py
r
variable and the names of the columns in the fast_vessel_processor
Based on the data found in the Kafka topic used (fast_vessel_processor
generated box plot will look as follows:

Using Jupyter
A Jupyter Notebook allows you to create documents that contain live code, equations,
visualizations and narrative text in a web browser.
The presented Python 3 code will create a box plot based on the data found
in a Kafka topic inside a Jupyter notebook. The presented code is based on the
Python 3 code of plot_data.py
The Python 3 code used in the Jupyter notebook is as follows:
```
from lenses_python.lenses import lenses
import pandas as pd
import numpy as np

from ipywidgets import interact
%matplotlib notebook

import matplotlib as mpl
import matplotlib.pyplot as plt

data=lenses("http://127.0.0.1:3030","admin","admin")

print("Listing all topics")
print(data.TopicsNames())

r = data.SqlHandler(
  'SELECT * FROM `fast_vessel_processor`',
  ['speed'])

print("Type:", type(r))

for i in r:
    print(i)

dataToPlot = []

for index, row in r.iterrows():
    dataToPlot.append(row['Speed'])

# Create a figure instance
fig = plt.figure(1, figsize=(9, 6))

# Create an axes instance
ax = fig.add_subplot(111)

# Create the boxplot
bp = ax.boxplot(dataToPlot)
```
The output image of the previous code is the following:
The output image is the same as the one generated by plot_data.py
use the same Kafka topic (fast_vessel_processor
Python Live Data Queries
The library also provides support for live streaming queries via SQL. See https://docs.lenses.io/dev/python-lib/index.html#continuous-queries for more details.
Conclusions
The Lenses Python 3 library allows you to write handy and intelligent utilities
that communicate with Lenses and take advantage of the power of the Python 3
programming language.
Want to start learning more about Kafka ?