Apache Kafka monitoring & observability to drive engineering productivity
Confidence with Apache Kafka depends on engineers having unified visibility of real-time data & applications. Or you end up with whiplash from swivelling between so many screens and Kafka monitoring tools.

Monitoring any distributed environment is hard; then there’s Kafka monitoring!
Infinite failure modes can impact the performance & availability of a Kafka streaming app.
Monitoring your Kafka infrastructure by looking into Replica Fetcher Threads and Disk Write wait times won’t save you if there’s schema drift, incorrect ACLs, maxed-out Quotas or poor partitioning.
When you have to troubleshoot a Kafka flow, where do you start to figure out what the heck is going on?
What is Kafka monitoring? What are the benefits?
Apache Kafka is a complex a black box, requiring monitoring for many services including Schema Registry, Kafka Connect and real-time flows.

Higher engineering productivity
A Kafka UI to monitor consumer lag, partitioning, schemas & more, saving engineering from maintaining multiple tools.

Better quality code
Inspect data streams with SQL to understand how your microservice is behaving.

Improving service levels
Metrics & real-time alerts on Kafka performance & streaming flows.

“Lenses is critical for us in making our teams productive with Kafka and giving confidence to hundreds of developers.”
VP of IT Engineering at Playtika - Ella Vidra
Best practices for Apache Kafka monitoring
Are my real-time data platform, streaming applications and data healthy?
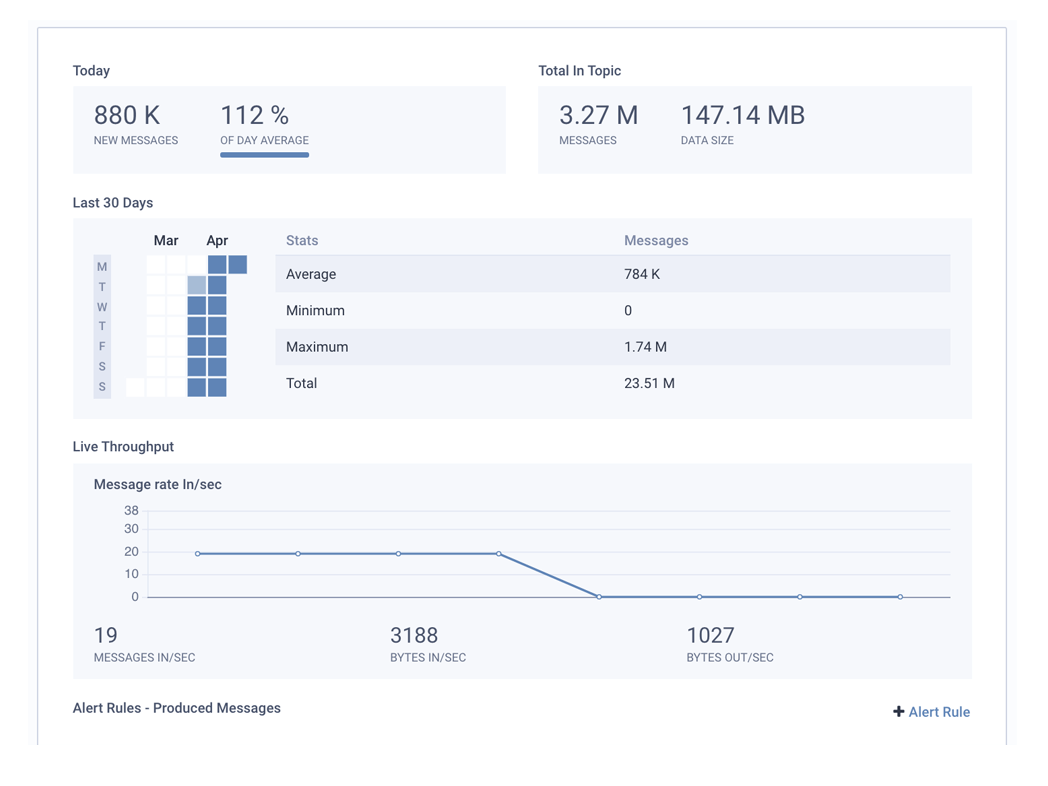
Monitor Kafka infrastructure & application performance from a single role-based and secured Kafka UI. Spinning up full-service visibility helps stay on top of your data and app health.
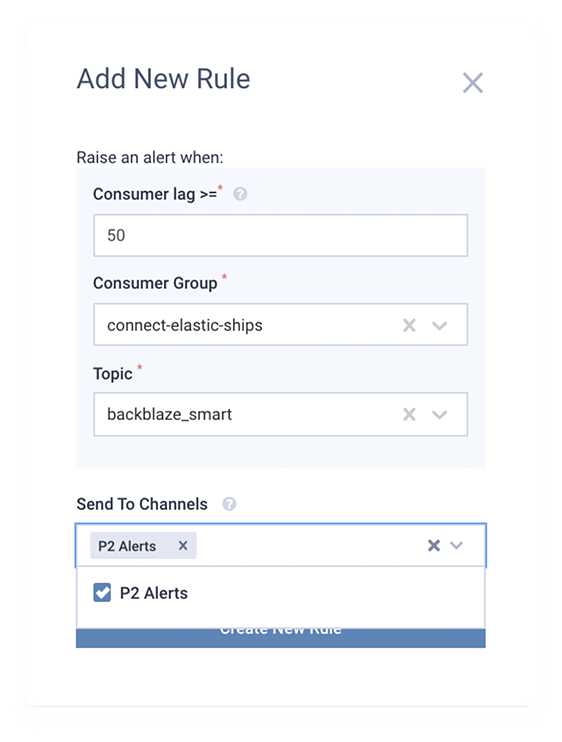
How can I be alerted of any problems in Kafka?
Consumer lag? Under-replicated partitions? Or is your Kafka cluster down? Trigger alerts in real time to your incident management tools including AWS Cloudwatch, Prometheus Alert Manager, Slack, PagerDuty, Splunk or DataDog .
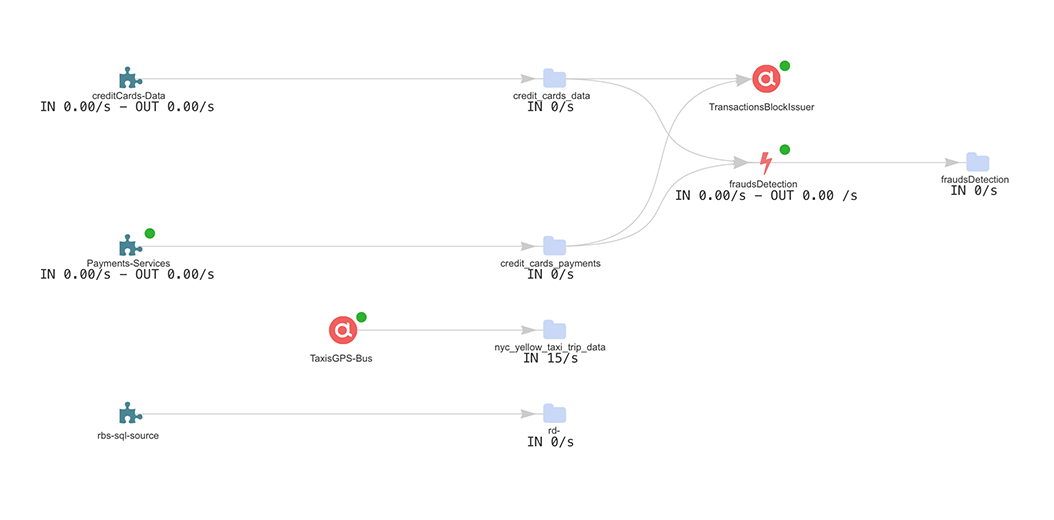
My Kafka applications are all over the place! How can I see how my streams are connected?
View & monitor streaming data pipelines via a Topology view that dynamically shows deployed Kafka Connect connectors and custom microservices connected to your topics.
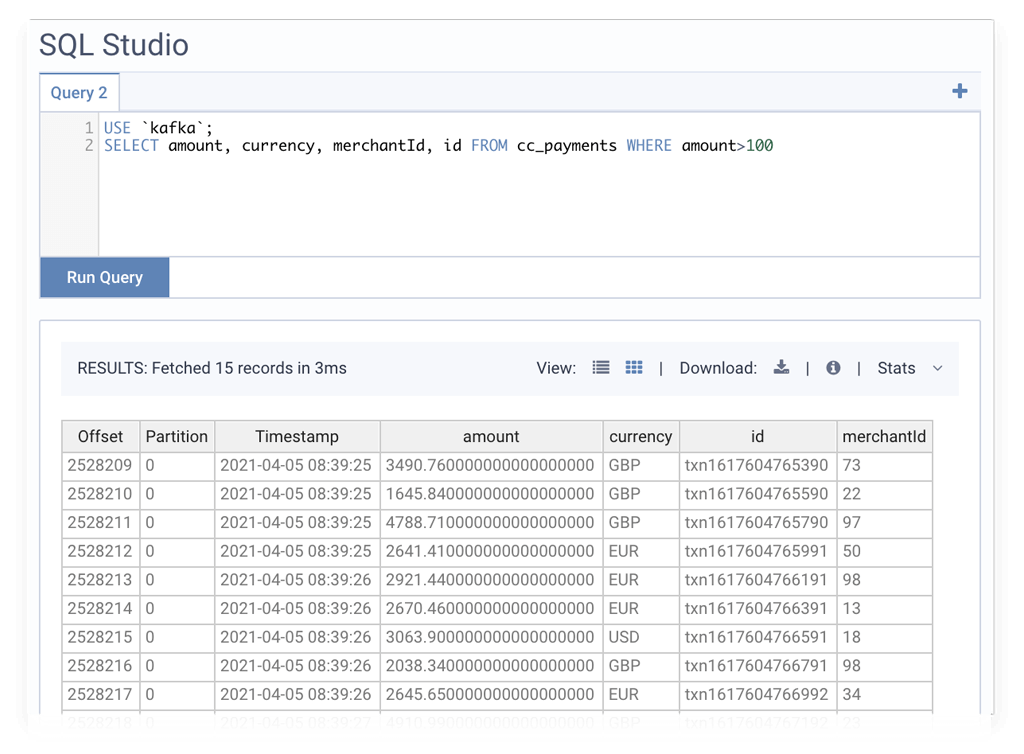
How can I view events inside my Kafka topics?
Troubleshoot by exploring events using SQL via a Kafka GUI or API. Lenses intelligently understands your data regardless of serialization: Avro, Protobuf, JSON, CSV and more.
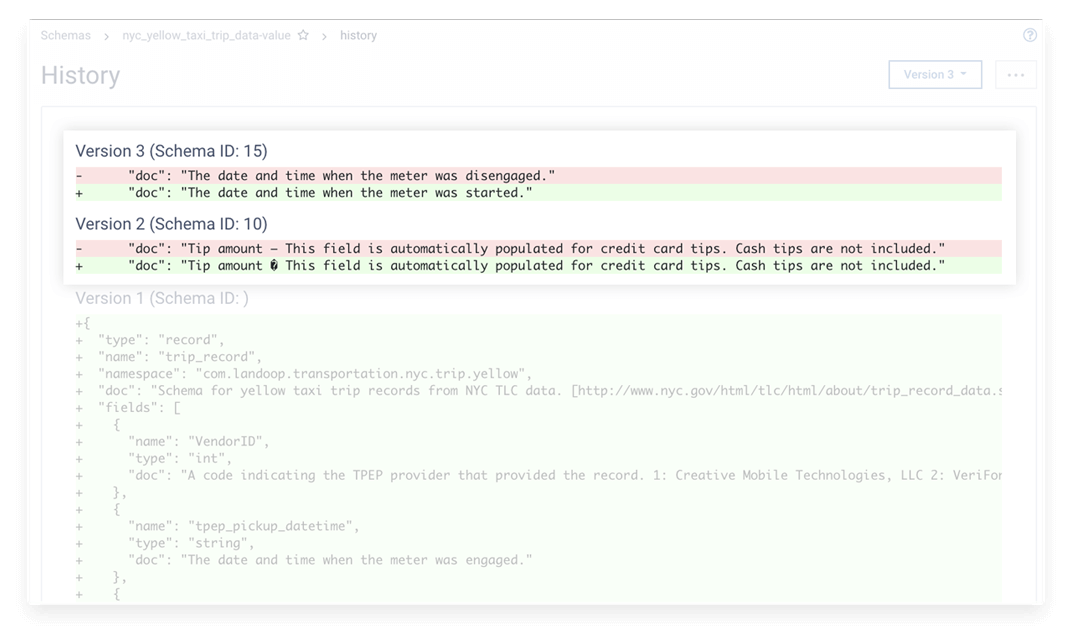
How can I explore Schemas, Quotas and ACLs to troubleshoot my application?
Get to that root-cause by viewing schemas, Quotas and ACLs all within a secured & unified Kafka UI and API.
Kafka monitoring architecture

What Kafka components should I monitor?

Business Service

Application

Flows

Data

Brokers

Zookeeper

Schema Registry

Connect

System

Network
Case Study

Kafka monitoring for a healthtech unicorn
Exploring a universe of events using a simple SQL-like syntax helps Babylon Health engineers to troubleshoot their microservices.