Will Murphy
Why SQL is your key to querying Kafka
What's going on with the streaming data in there?

Will Murphy
If you’re an engineer exploring a streaming platform like Kafka, chances are you’ve spent some time trying to work out what’s going on with the data in there.
But if you’re introducing Kafka to a team of data scientists or developers unfamiliar with its idiosyncrasies, you might have spent days, weeks, months trying to tack on self-service capabilities.
We’ve been there.
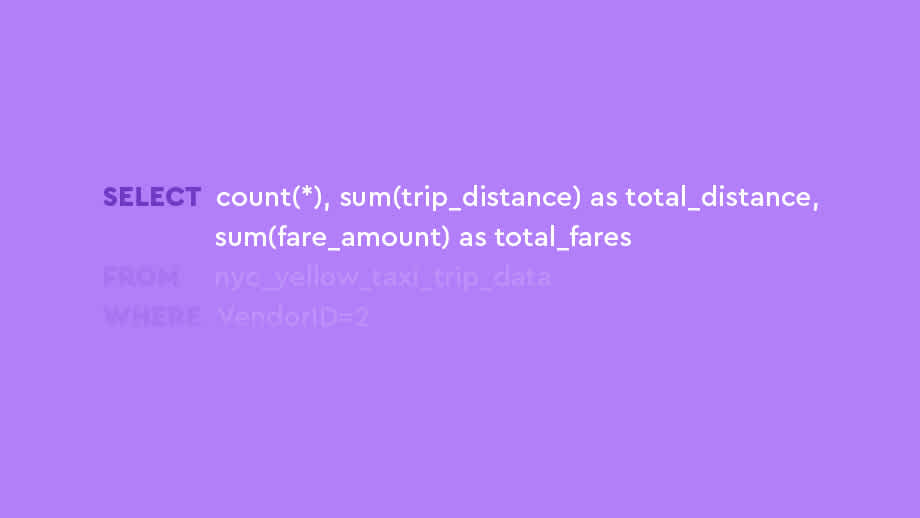
Here we’ll explain why and how we did just that with a tool you may find surprising for streaming technologies - SQL.
We talk elsewhere about using SQL to build streaming applications with Kafka, but what about using SQL for ad-hoc queries of Kafka topics?
To many developers, this may seem like a strange idea - after all, SQL was designed for (and is still most often used for) accessing relational databases, and a streaming platform like Kafka is quite a different beast. On top of that, our pipelines often involve shipping the data from Kafka to other data stores such as Splunk, Elasticsearch or even a SQL database, all of which provide rich querying capabilities.
But the fact is, sometimes we really want to know what’s going on with our data when it’s inside Kafka. Most of us, as a first port of call, might reach for the command line tools that ship with Kafka, or the Swiss Army knife that is kafkacat. Here is our attempt at looking at the contents of a Kafka topic on a Lenses Box docker container running on my local machine, using Kafka’s kafka-console-consumer to query a topic containing a record of taxi rides in New York:
Processed a total of 3 messages
So, after reading the documentation to figure out the necessary parameters, my reward is the above, fairly incomprehensible output.
Because the messages on that particular topic happen to be in AVRO format, the raw message content is unlikely to be very helpful. If the messages had JSON payloads, I’d be a bit better off, and I might be able to use a tool such as jq to isolate the information that I want to see. Depending on the data involved, it could take a while to find exactly what I’m looking for.
As developers, most of us want to be familiar with, and if possible to master, the command line tools that we use most often. But in the cloud era, where even a small project typically involves a plethora of technologies, it becomes impractical to know every command line tool well. This is where being able to fall back on something that we do know well, in this case SQL, becomes appealing.
And the above example is for the simple case where we want to look at data on a local docker image. What if there’s a problem in production and we need to see what the data looks like there? Better hope that your colleague in DevOps has got over that time that you had the nerve to suggest that golang isn’t the be all and end all of programming languages.
Quite some time later, via a labyrinth of ssh connections and after lots of googling on the topic of Kafka authentication, you might get to the point of being able to see the same kind of unfriendly output as in the local docker example above. By the time you’re starting to get visibility of what’s going wrong, you and your DevOps colleague are getting tired.
It’s Friday, and it’s nearly time for the first beer of the evening. But you know that beer will be served with a shot of anxiety: does the CDO need to find out about this?
How will they feel about you watching screens full of un-redacted Personally Identifiable Information scrolling by?
Having a secure yet accessible interface for Kafka doesn’t benefit just developers.
Data flowing in Kafka is typically at the early phase of a data pipeline, meaning it is raw and rich in information and accessible prior to a dashboard being created or landing in a data warehouse. It would be as useful to a product owner measuring user engagement for a new product, or as a data scientist exploring what features to extract from a raw dataset on the wire.
And because the language involved is SQL, it can be used directly by those that aren’t comfortable with Kafka or prefer not to use a command line.
Since the SQL interface is a layer of indirection between the user and Kafka, data access can be protected through a namespaces-based security model.
So, getting back to our aforementioned nyc_yellow_taxi_trip_data topic, which contains trip data being sent by taxis in real-time. Let’s imagine that our analytics dashboard is showing that the average trip distance for a particular vendor has decreased, even though the trip times seem normal, as do the fares.
Something unusual is going on, but what?
In the past we’ve seen issues like this caused by bugs introduced by upgrades to firmware of the taxi meters, but we’ve also recently made changes to our analytics pipelines, which could also be a factor. As Kafka is the part of our system where we initially store the raw data received from the meters, looking at the data in Kafka could help us to narrow things down.
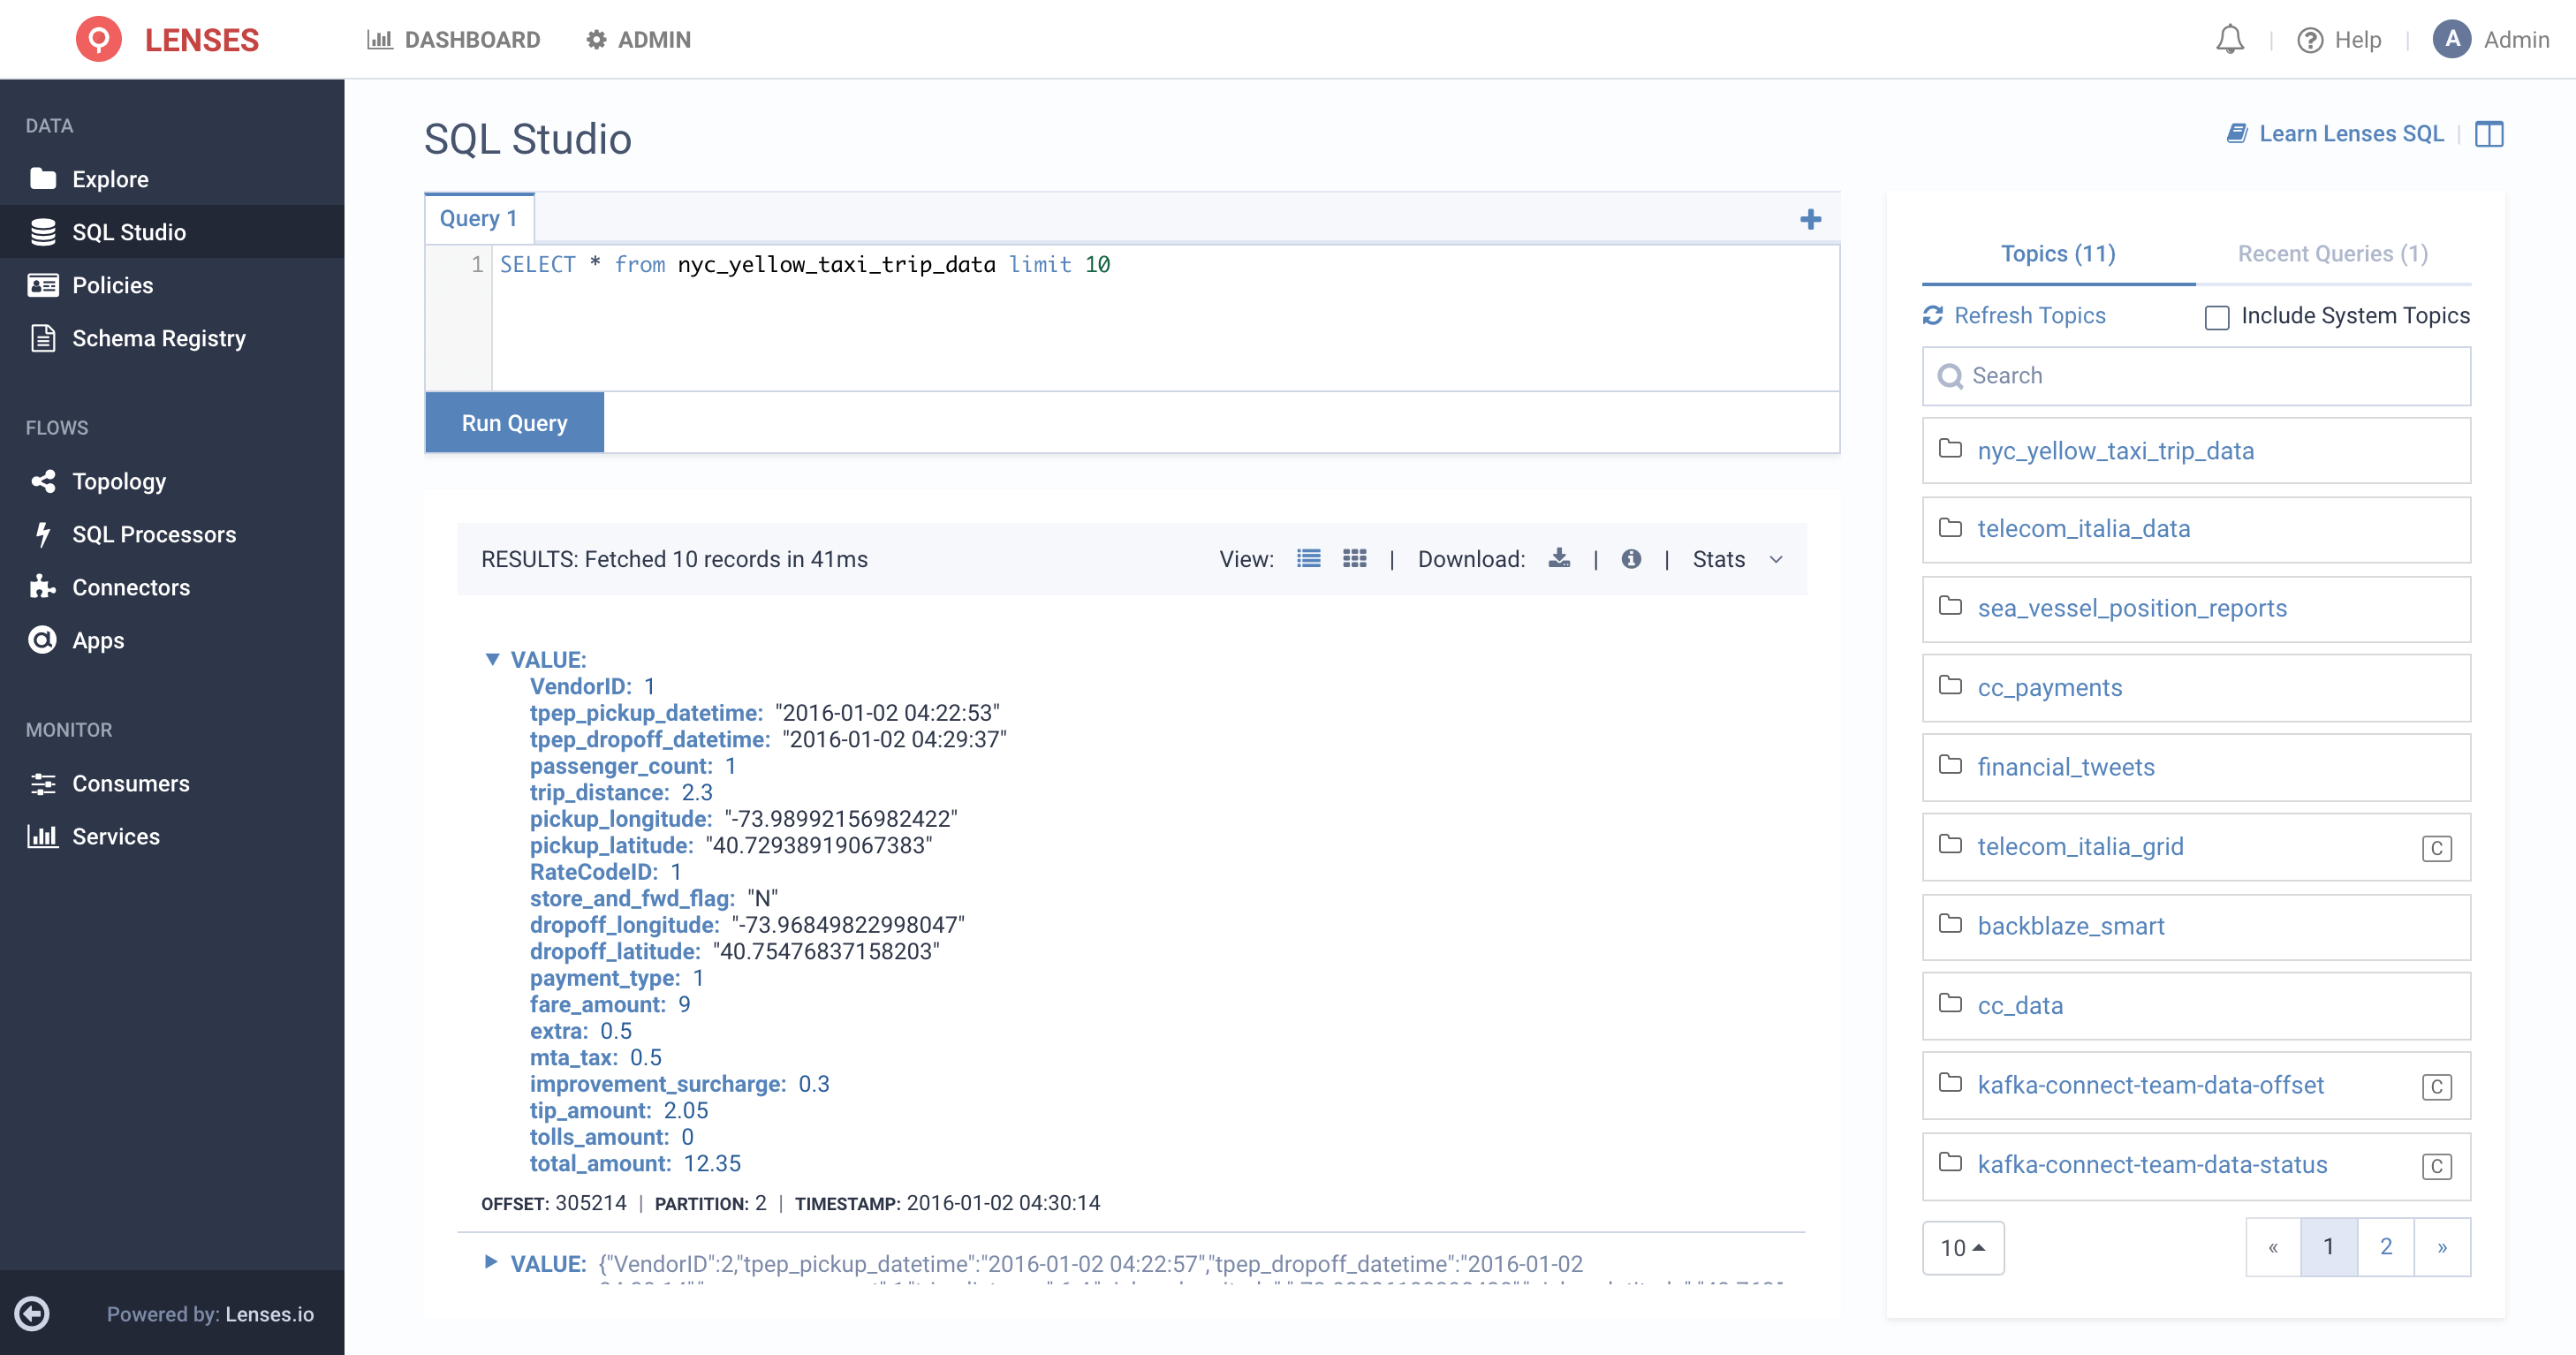
Firstly, we’ll take a look at the topic in order to get an idea of the structure of the data:

The discrepancy started appearing in our analytics for the previous day, and we know that the affected vendor has a VendorID of 2, so let’s try to get a picture of what things looked like for a 5 minute period yesterday afternoon.
A naive query might look like this:
When we’re running against a local docker instance, or a test environment with a small data set, we can simply execute any query that we dream up.
But production can be a different story.
Regardless of the technology being used, the key to designing an efficient query is to understand the way that the data is stored. The following is a heavily simplified representation of what a Kafka record looks like:

Key and Value are the actual payload(s) of the message. In the case of our current topic, in fact the key is empty, and so our data is stored in Value. It’s important to remember that these payloads are pretty much entirely opaque to Kafka. So, while we’re storing all sorts of nice, structured AVRO data there, the only way we can find a field with a specific value is to read every single message on the topic, looking for that value.
This is obviously inefficient.
At least quotas can be used to ensure that such queries don’t cause any performance problems on our production system, but that doesn’t help us to get the information we’re looking for. Fortunately, while the Key and Value in the diagram above are opaque to Kafka, the Offset and Timestamp are not.
In our original query, we were trying to narrow down to a specific time period using the tpep_dropoff_datetime field. But as the meters are sending us this information pretty much in real time, we can take advantage of the fact that the timestamp stored in the Kafka record should be quite close to the value of tpep_dropoff_datetime, but with the advantage that it’s being indexed by Kafka. For other problems it might make more sense to narrow down by offset or partition number, but timestamp is perfect in this case.
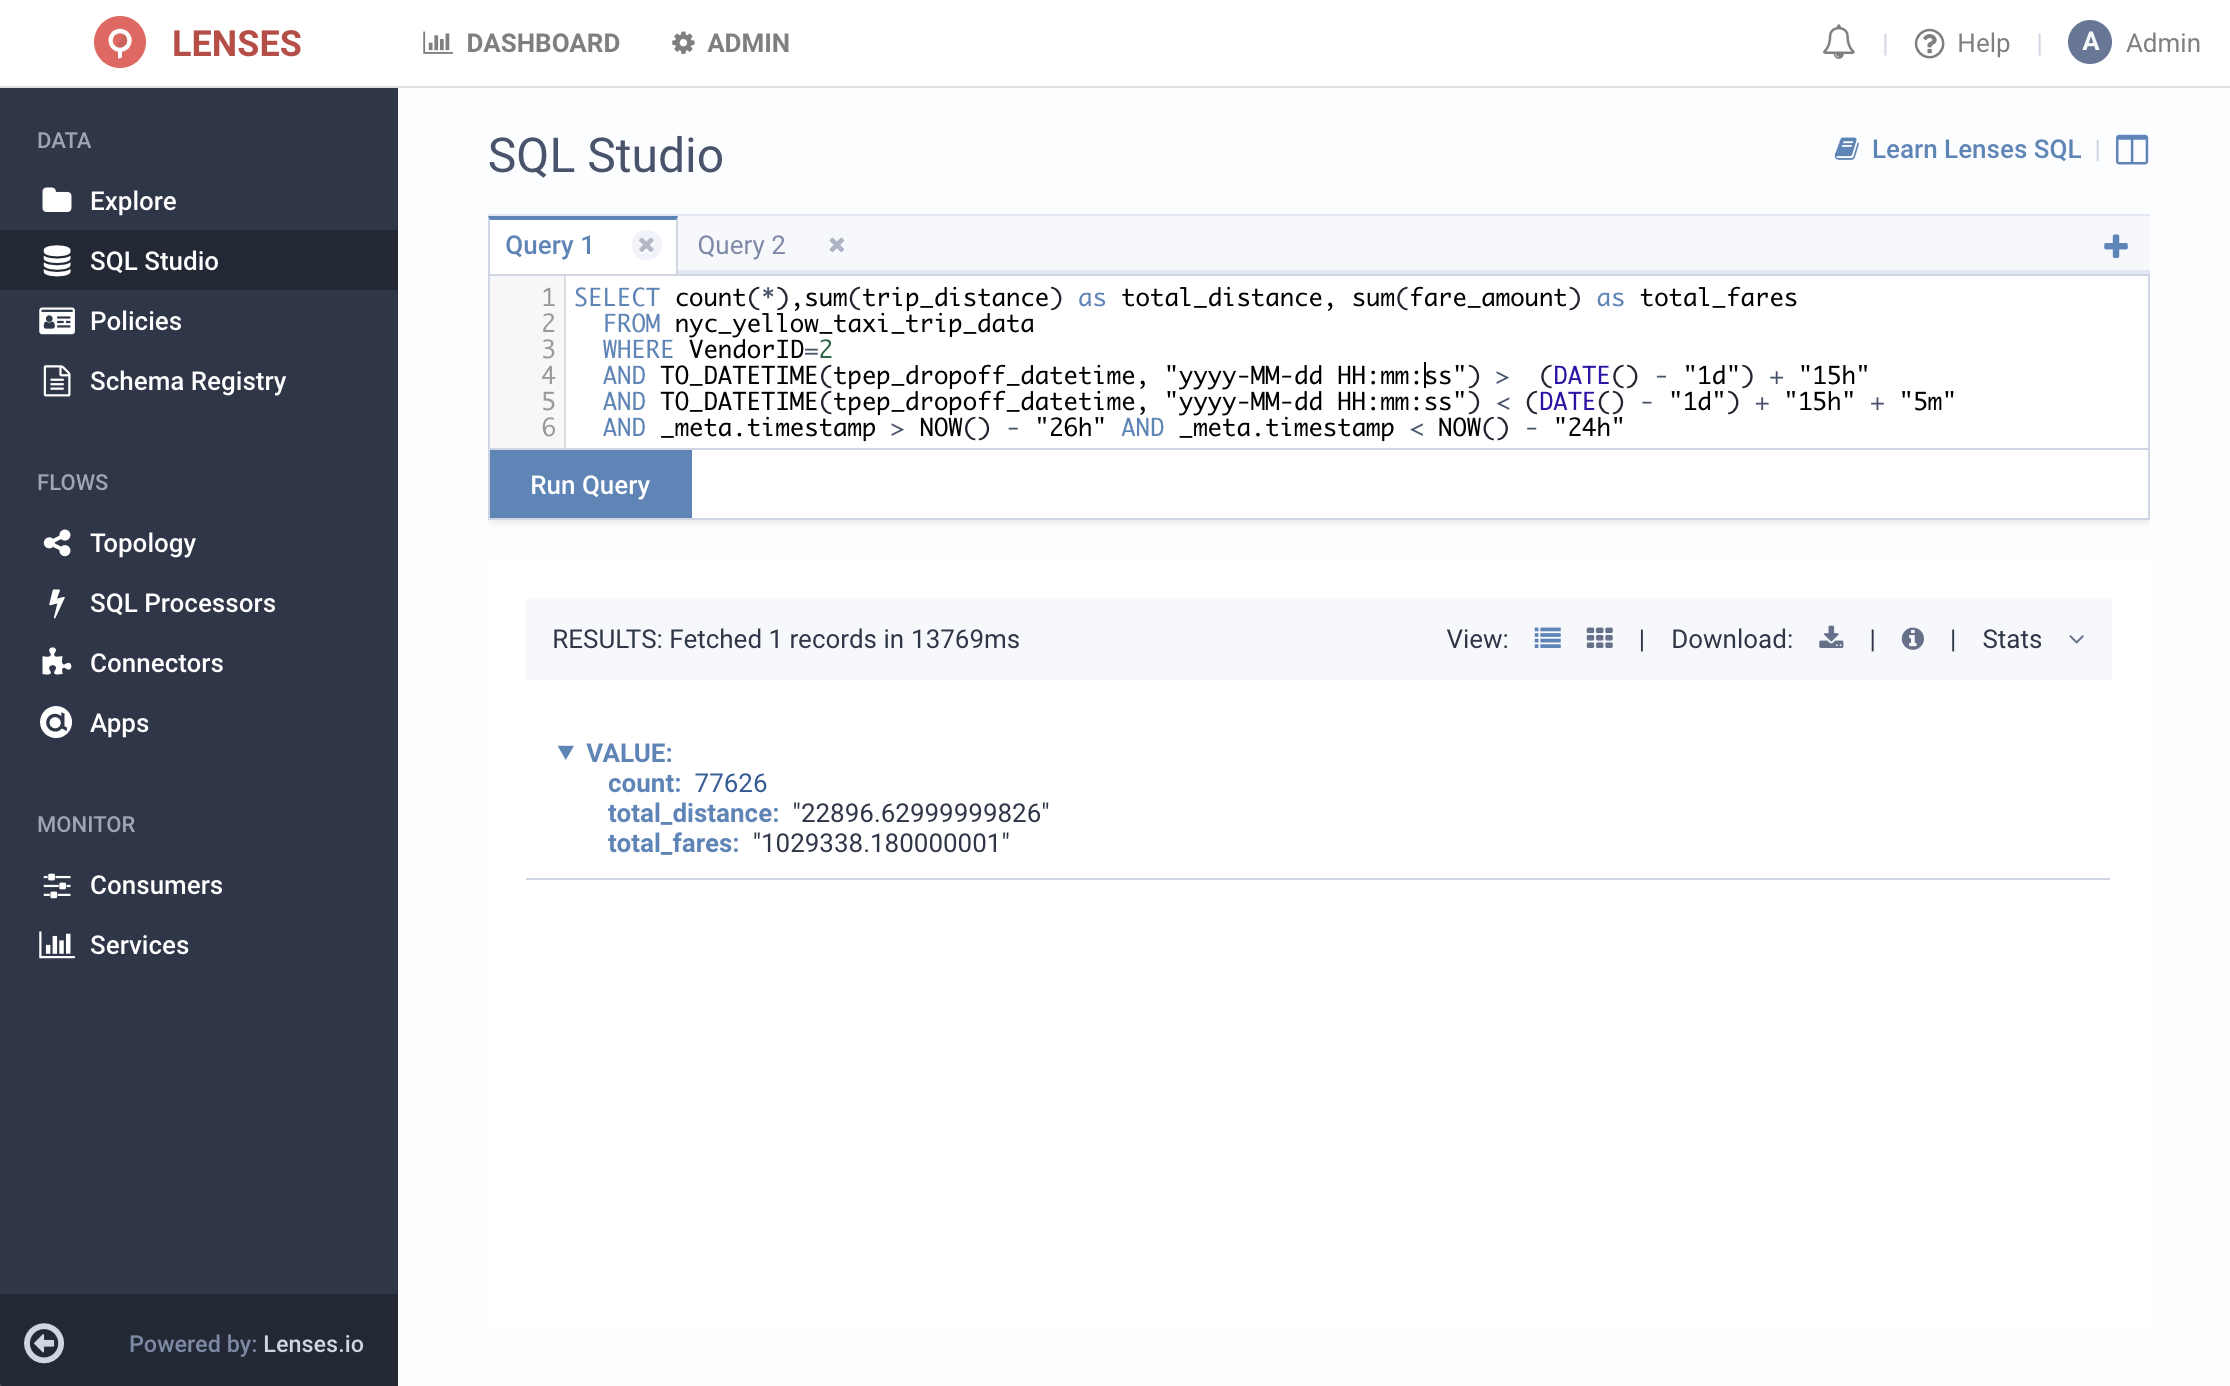
Here is our new query, where we use _meta.timestamp in order to refer to the timestamp at the Kafka record level rather than the one in our payload:

You’ll notice in the above search we are filtering to a 2 hour window using the _meta.timestamp for search-efficiency reasons and then further filtering to a specific 5 minute window using the tpep_dropoff_datetime field. The extra buffer is in case the dropoff timestamp isn’t exactly in line with the timestamp held in Kafka.
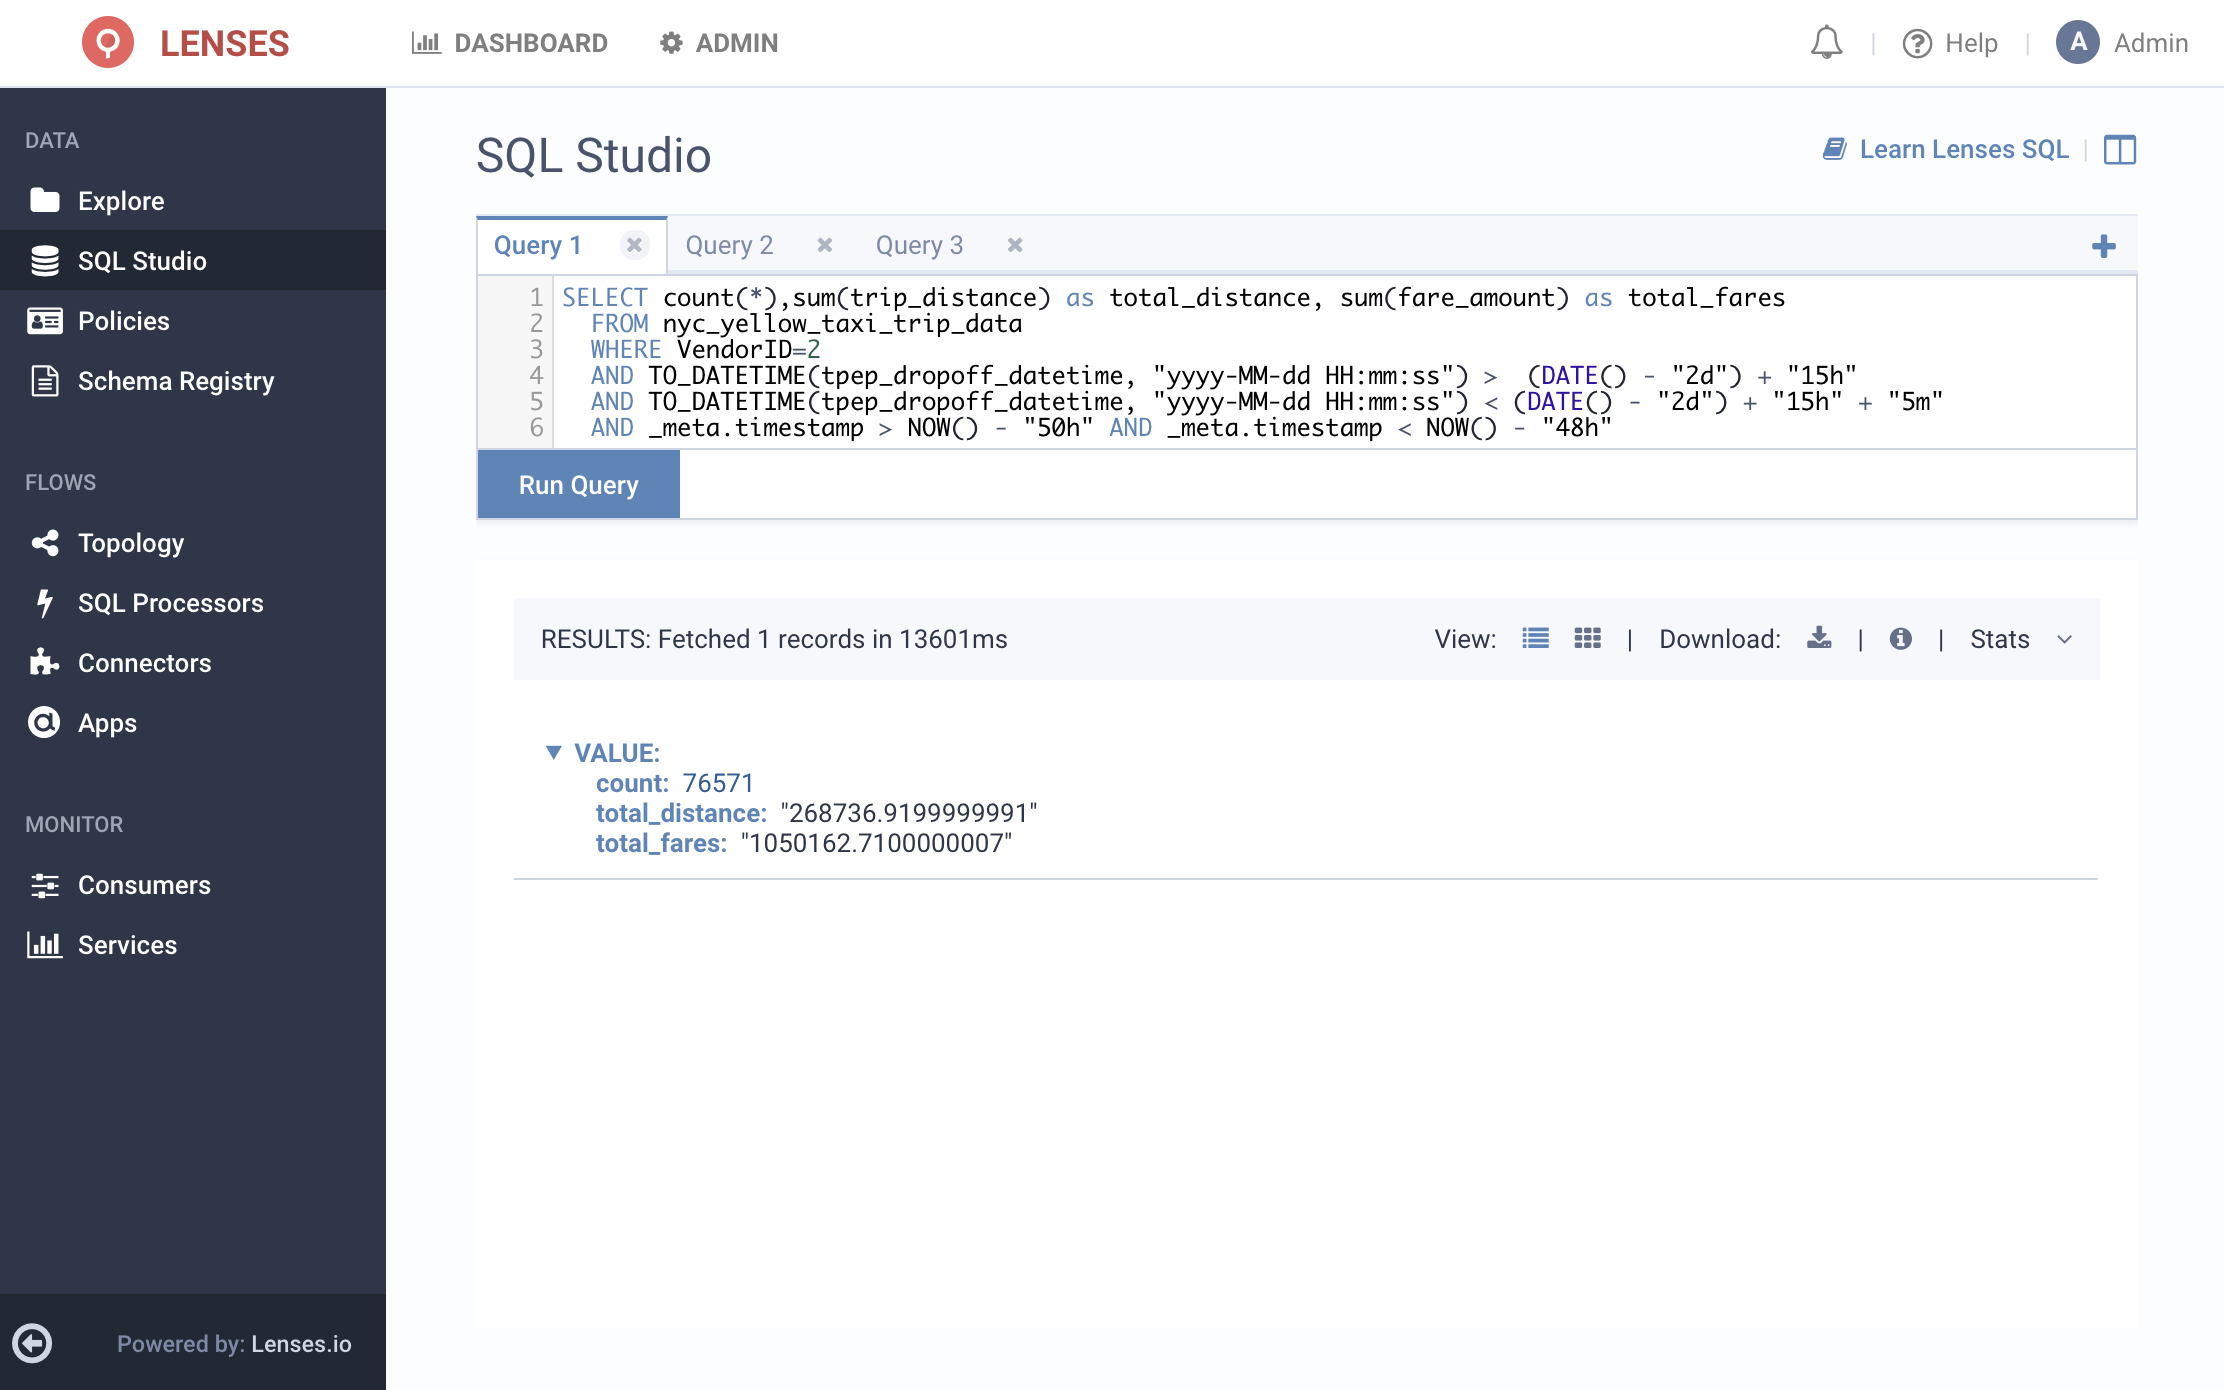
Now let’s compare this to the result from two days ago, before the problem had manifested itself:

Once again here, we’re pre-filtering the results to a two hour timeframe using _meta_timestamp field.
A careful look at the results indicates that although the number of trips and the fares are similar for the particular time period across the two days, the total distance over this time period is actually about ten times lower for yesterday’s data compared to two days ago! From here, we may want to sample other time periods to make sure that what we just saw isn’t a fluke. Alternatively, a natural progression might be to build a continuously running Streaming SQL App that samples data quality over a sliding period of time and populates another Kafka topic as alerts.
See Matteo’s blog on our Streaming SQL engine.
As engineers we’ve tried to build a way for our community to open up data to the organization - and get to the heart of issues caused by mere moments such as a fluctuation in taxi meter metrics, or a message being missed.
In the meantime, how long will it take for your business to notice how inefficiently you’re accessing data? And how many compliance audits will you have to fail before that happens?
If you have Kafka, you can download Lenses for free. If you don’t have a Kafka environment, try out these use cases by downloading our all-in-one Kafka docker Box or via our free cloud environment! See: lenses.io/start
See for yourself and let us know what you think.