MQTT to Kafka to InfluxDB to view data in Kafka.
Time-series data stores are of particular interest these days and influxDB is a popular open source distributed time-series database.
In this tutorial we will integrate Kafka with InfluxDB using Kafka Connect and implement a Scala Avro message producer to test the setup.
The steps we are going to follow are:
- Setup a docker development environment
- Run an InfluxDB Sink Kafka Connector
- Create a Kafka Avro producer in Scala (use the schema registry)
- Generate some messages in Kafka
Finally, we will verify the data in influxDB and visualize them in Chronograph.
About InfluxDB
Data in influxDb is organized in time series
points
time
measurement
tags
fields
null
The structure is of the data is:
measurement,tagKey1=tagVal1,tagKey2=tagVal2 fieldK1=fieldV1,fieldK1=fieldV1
Example:
```
INSERT temperature,machineId=1,type=boiler actualTemperature=30,targetTemperature=32
```
Setup the environment
For both the InfluxDB and Kafka ecosystem setup we are going to use Docker.
If you don’t have docker installed on your machine, follow the instructions on their website.
InfluxDB setup with Docker
Run the docker image:
$ docker run -p 8086:8086 -v influxdb:/var/lib/influxdb influxdb
Enter the InfluxDB Shell and create a database and a user:
```
$ influx --host localhost --port 8086
> CREATE DATABASE devices
> CREATE USER root WITH PASSWORD 'root'
> GRANT ALL ON devices to root
```
You may find more info on this docker image here.
Kafka setup with Docker
In order to set up Kafka we will need a set of systems to be installed. We are going to use fast-data-dev docker image, which includes everything we need for this tutorial:
- Kafka Broker
- ZooKeeper
- Kafka Connect
- Kafka REST Proxy
- Schema Registry
- Landoop’s UI tools
- DataMountaineer Connectors (in our case InfluxDB will be used)
- Embedded integration tests with examples.
Run the docker image:
```
docker run --rm -it -p 2181:2181 -p 3030:3030 -p 8081:8081 -p 8082:8082 -p
8083:8083 -p 9092:9092 -e ADV_HOST=localhost landoop/fast-data-dev
```
You may find more on fast-data-dev documentation here.
While this is running for the first time it will run some integration tests and create some topics and connectors for you. You are able to access the landing page for the container at http://localhost:3030
Once it’s up and running you may access:
- the Kafka Broker logs:
docker exec <ID> tail -f /var/log/broker.log
- the Kafka Connect logs:
docker exec <ID> tail -f /var/log/connect-distributed.log
- the docker bash:
docker run --rm -it --net=host landoop/fast-data-dev bash
IoT example
Data usually originate from somewhere. For example, an embedded sensor can produce data at frequent intervals. For the shake of the example we are going to create a simple Kafka Producer in Scala to transmit some metrics
can also be used instead of the Scala appkafka-avro-console-producer
The data structure looks like this:
```
case class DeviceMeasurements(
                  deviceId: Int,
		              temperature: Int,
      			      moreData: String,
		              timestamp: Long)
```
We are going to send these messages in a Kafka topic named as device-measurements-topic
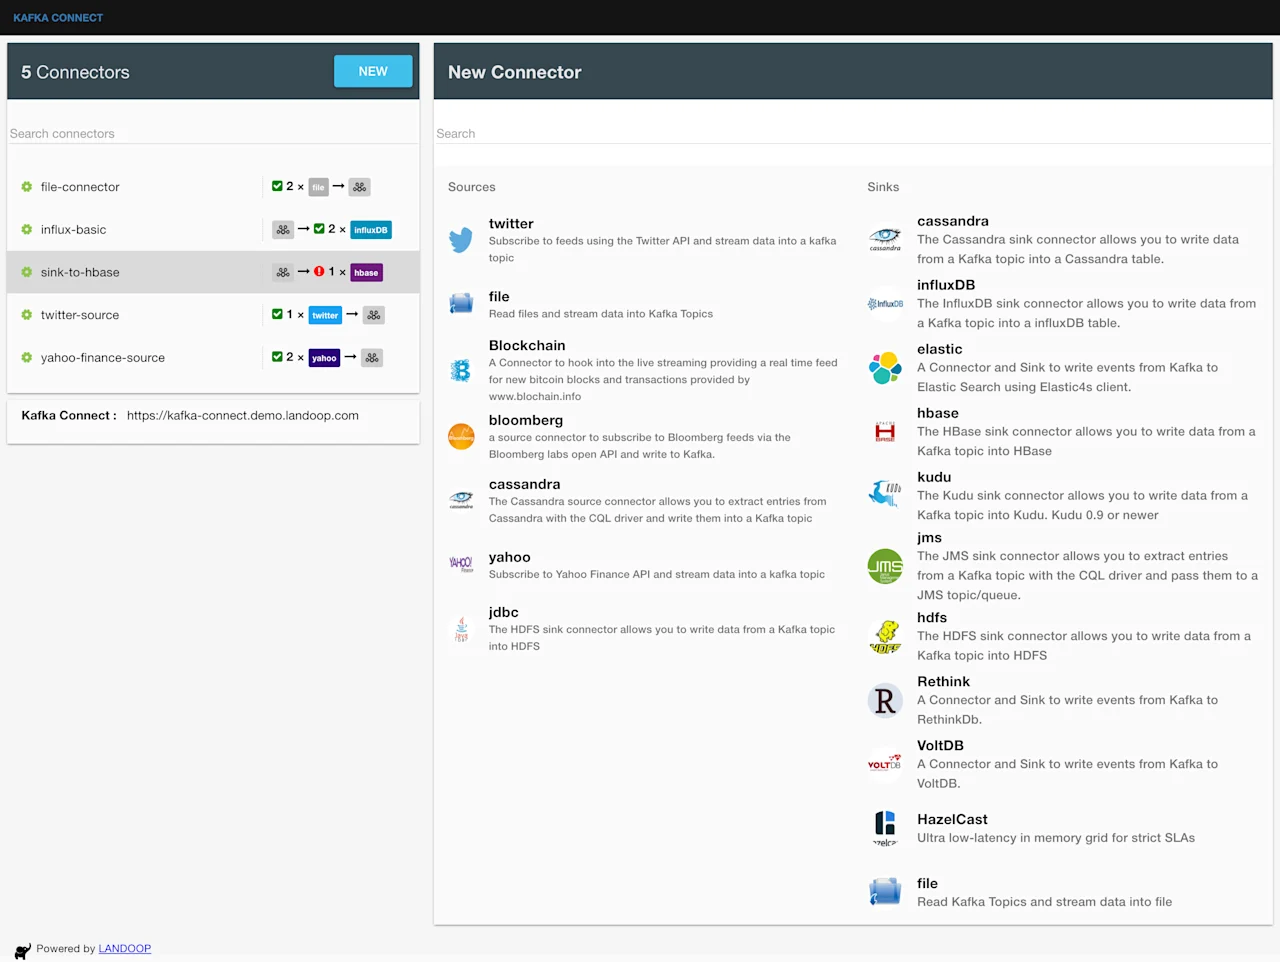
InfluxDB sink connector in Kafka Connect
Our fast-data-dev
of the available plugins
Let’s find the IP address of the docker used by the influxDB container (usually 172.17.0.x)docker inspect <ID or NAME> | grep IPA
```
   "SecondaryIPAddresses": null,
   "IPAddress": "172.17.0.2",
   "IPAMConfig": null
```
We will now use the kafka-connect-ui to configure the connector:
or from command line:
```
cat << EOF > influxdb.json
{
 "name": "influx-sink-connector",
   "config": {
	  "connector.class": "com.datamountaineer.streamreactor.connect.influx.InfluxSinkConnector",
	  "tasks.max": "1",
	  "topics": "device-measurements-topic",
	  "connect.influx.username": "root",
	  "connect.influx.password": "root",
	  "connect.influx.db": "devices",
	  "connect.influx.url": "http://172.17.0.2:8086",
	  "connect.influx.kcql": "INSERT INTO deviceMeasurement SELECT deviceId, temperature, timestamp FROM device-measurements-topic WITHTIMESTAMP timestamp"
	}
}
EOF
curl -X POST -H "Content-Type: application/json" -H "Accept: application/json" -d @influxdb.json http://localhost:8083/connectors
```
KCQL query explained
InfluxDB Sink connector supports KCQL (Kafka Connect Query Language) and this allows us to filter fields from a Kafka topic without needing to do any extra processing. Let’s say in our case we are only interested in storing the temperature for a particular device in a time series within InfluxDB.
The query looks like this:
```
INSERT INTO deviceMeasurement SELECT deviceId, temperature, timestamp
  FROM topicDeviceMeasurement WITHTIMESTAMP timestamp
```
deviceMeasurement
measurement
will add theWITHTIMESTAMPin the point. If we omit it from our query then influx will add a system timestamp.time
Avro Producer using Avro4s
Now lets create a simple producer that sends these types of event messages into Kafka. We are going to use Avro format so that we can maintain the schema of the data in the Schema Registry. In this example both the key
value
```
import java.util.Properties
import java.util.concurrent.Future

import com.sksamuel.avro4s.{FromRecord, RecordFormat, ToRecord}
import org.apache.avro.generic.GenericRecord
import org.apache.kafka.clients.producer._

class KProducer[K <: Product, V <: Product] {

  val kafkaProps = new Properties()
  kafkaProps.put(ProducerConfig.BOOTSTRAP_SERVERS_CONFIG, "127.0.0.1:9092")
  kafkaProps.put(ProducerConfig.VALUE_SERIALIZER_CLASS_CONFIG,
     classOf[KafkaAvroSerializer].getCanonicalName)
  kafkaProps.put(ProducerConfig.KEY_SERIALIZER_CLASS_CONFIG,
     classOf[KafkaAvroSerializer].getCanonicalName)
  kafkaProps.put("schema.registry.url", "http://127.0.0.1:8081")
  private lazy val producer  = new KafkaProducer[GenericRecord, GenericRecord](kafkaProps)

  def produce(topic: String, key: K, value: V, partition: Int = 0)
    (implicit to: ToRecord[K], from: FromRecord[K], to: ToRecord[V], from: FromRecord[V])
    : Future[RecordMetadata] = {
    val keyRec = RecordFormat[K].to(key)
    val valueRec = RecordFormat[V].to(value)
    val data: ProducerRecord[GenericRecord, GenericRecord] = new ProducerRecord(topic, partition, keyRec, valueRec)
    producer.send(data)
  }
}
```
Generate messages to Kafka
We create the case classes that describe the schemas for the key
value
```
import com.github.nscala_time.time.Imports._
import scala.util.{Failure, Random, Success, Try}
object Example extends App {
case class Key(deviceId:Int)
case class DeviceMeasurements(deviceId:Int, temperature:Int, moreData:String, timestamp:Long)
val producer = new KProducer[Key, DeviceMeasurements]()
for (a <- 1 to 1000) { //you may want to adjust the number of messages here
val deviceMeasurement = getMeasurement(-10, 50)
val deviceID = getMeasurement(0, 10)
val timestamp = DateTime.now().getMillis
Try(producer.produce("device-measurements-topic",
Key(deviceID),
DeviceMeasurements(deviceID,deviceMeasurement,"",timestamp))) match {
case Success(m) =>
val metadata = m.get()
println("Success writing to Kafka topic:" + metadata.topic(),
metadata.offset(),
metadata.partition(),
new DateTime(metadata.timestamp()))
case Failure(f) => println("Failed writing to Kafka",f)
}
}
def getMeasurement(min:Int, max:Int) = Random.nextInt(max - min) + min
}
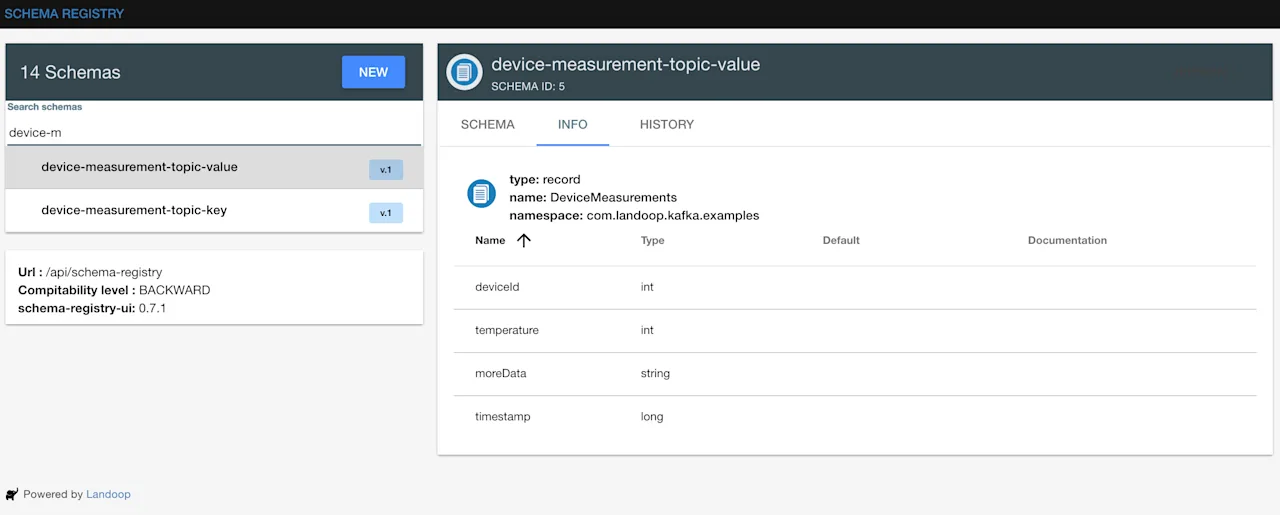
```Check the schema
In your schema registry you will find 2 automatically registered schemas: one for the key called device-measurement-topic-key
device-measurement-topic-value
We can see the schemas created in http://localhost:3030/schema-registry-ui
Validate the messages
We can see the Kafka messages generated in http://localhost:3030/kafka-topics-ui
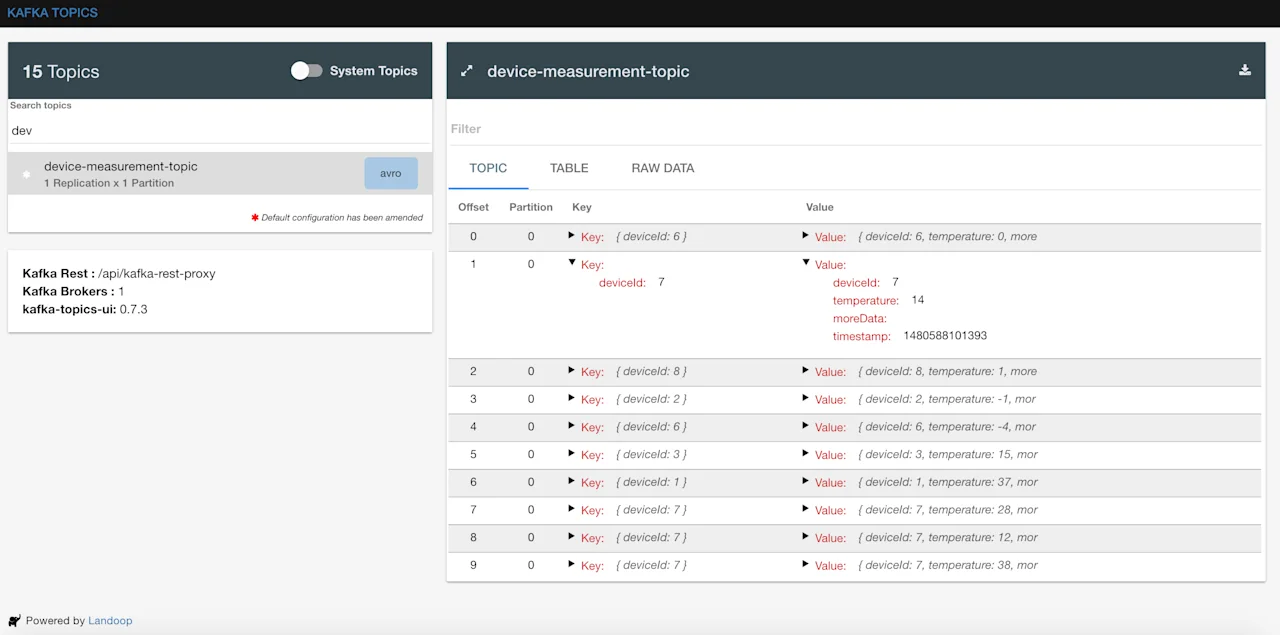
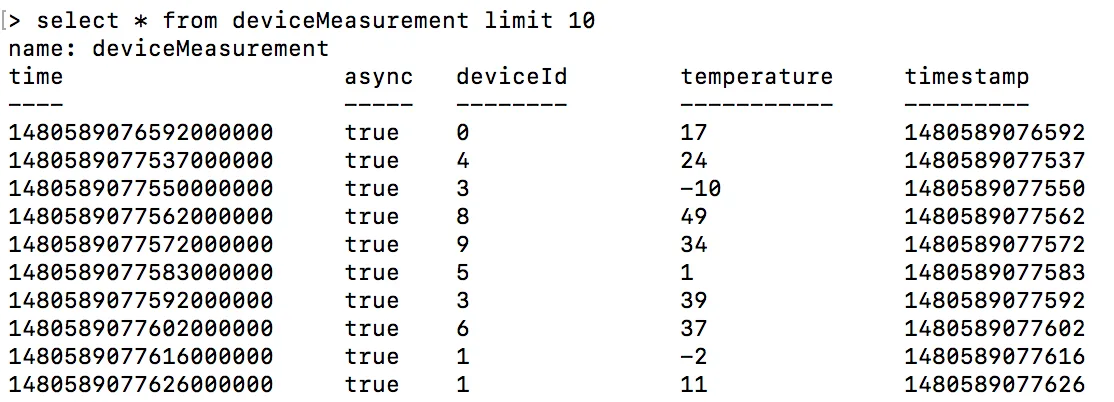
and also InfluxDB should also be getting data:
```
> USE devices
> SELECT * FROM deviceMeasurement
```
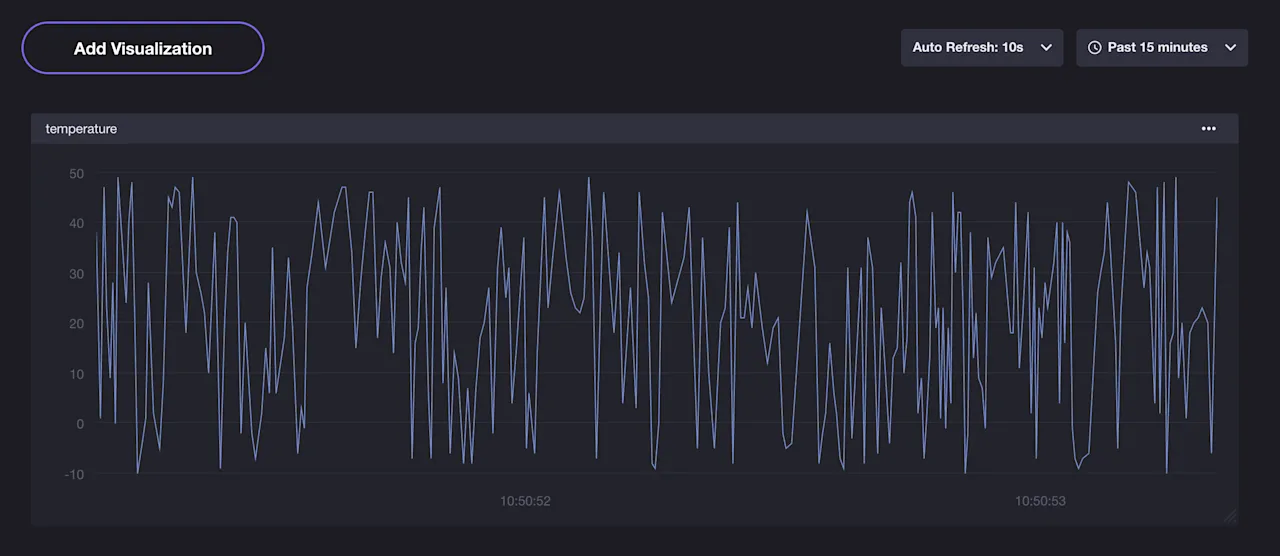
Visualise results
InfluxDB provides a visualization tool called Chronograf.
Here is how our time series chart may look like:
More
- Find the code for this example in GitHub
- InfluxBD connector
- InfluxDB docker image
- Landoop fast-data-dev docker image